
Figure 2.
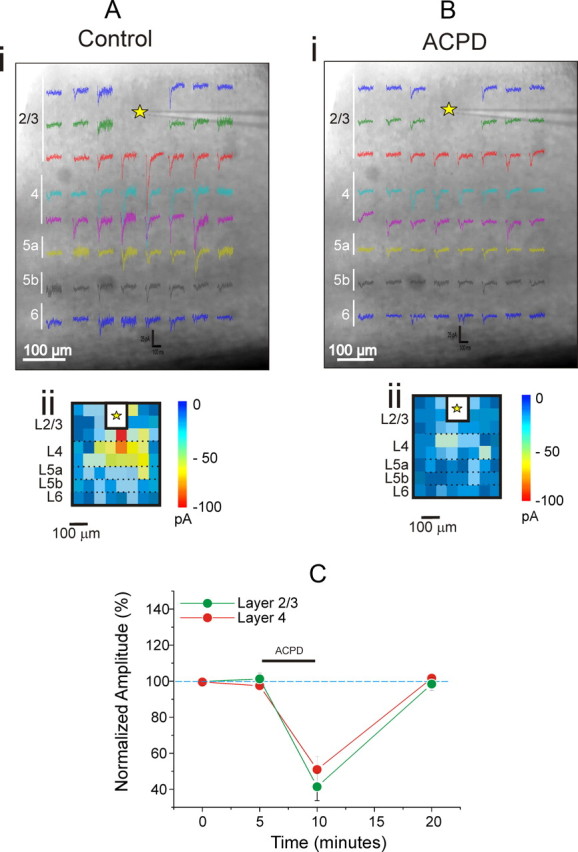
ACPD decreases synaptic responses evoked in layers 2/3 of V1 by photostimulation. A, B, Example of a photostimulation map in V1 before (A) and after (B) bath application of ACPD. The recording site in V1 is indicated by the yellow star, and false color maps are shown below (Aii, Bii). C, The graph shows the effects of ACPD on inputs from layers 2/3 and 4. Normalized EPSC amplitudes of evoked responses are shown before, during, and after the application of the agonist. ACPD was administrated after a stable base line period of 5 min. EPSC amplitudes are normalized to the mean of the base line values.