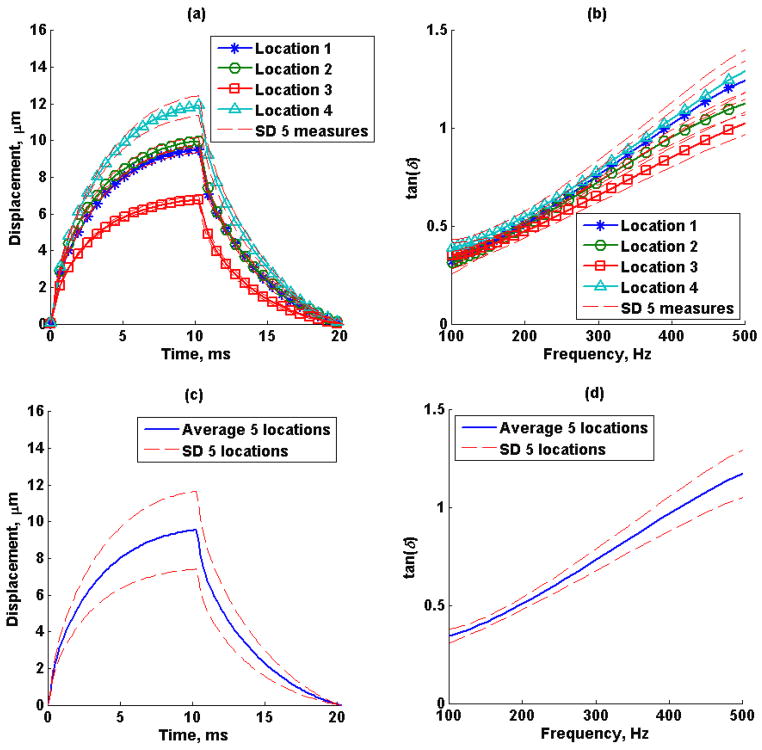
Figure 11.
Excised swine kidney (a) mean creep displacement, (b) estimated loss tangent of 5 repeated measurements in 4 locations, the dashed lines represent the standard deviation of 5 repeated measurements. (c) Mean creep displacement and (d) loss tangent of 5 locations, dashed lines represent the standard deviation of 4 locations.

