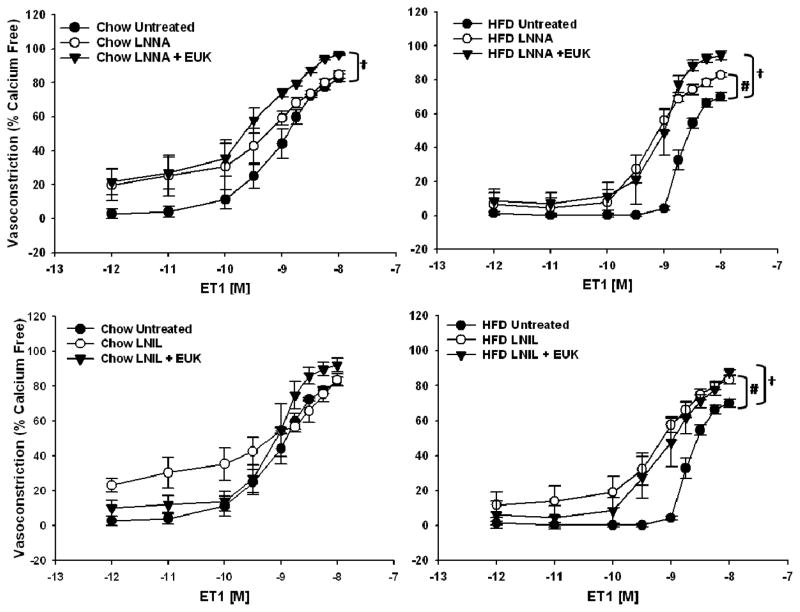
Figure 4.
Top Panels Vasoconstrictor responses in mesenteric resistance arterioles from Chow (n=4–7) and HFD-fed rats (n=5–6) to increasing concentrations of ET1. Responses from untreated Chow and HFD arteries repeated from Figure 3 and Chow and HFD LNNA data repeated from Figure 5 for comparison. Data are expressed as means ± SEM. #p<0.05 LNNA treated vs untreated vessels; †p<0.05 LNNA + EUK treated vs untreated vessels. Bottom Panels: Vasoconstrictor responses in mesenteric resistance arterioles from Chow (n=5–7) and HFD-fed rats (n=5–6) to increasing concentrations of endothelin-1 (ET1). Responses from untreated Chow and HFD arteries repeated from Figure 3 and Chow and HFD LNIL data repeated from Figure 5 for comparison. Data are expressed as means ± SEM. #p<0.05 HFD LNIL curve vs. HFD untreated curve; †p<0.05 HFD LNIL + EUK curve vs. HFD untreated curve.

