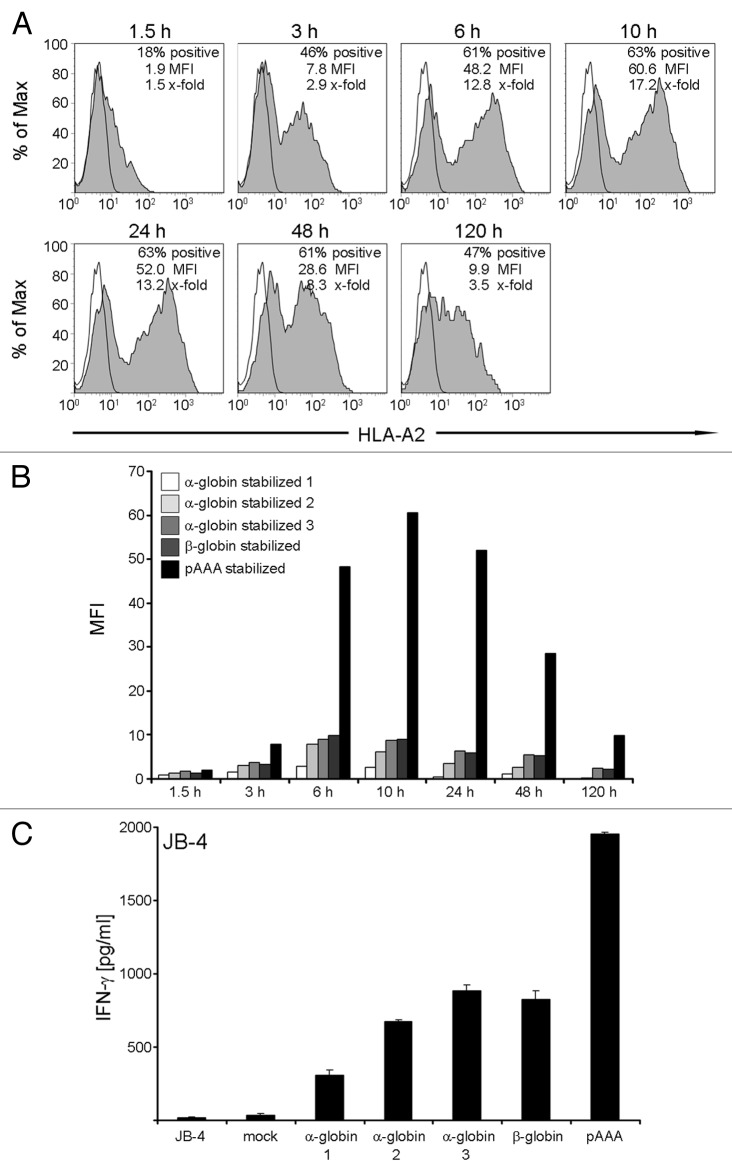
Figure 2. Kinetics of HLA-A2 expression and stimulatory capacity of ivt-RNA-transfected mDC from an HLA-A2- donor. (A) HLA-A2- mDC are electroporated with 25 µg HLA-A2 ivt-RNA prepared by the standard method. Surface staining of HLA-A2 is performed at different time points (1.5 h, 3 h, 6 h, 10 h, 24 h, 48 h and 120 h) after transfection and analyzed by flow cytometry. Stained samples are represented by filled gray curves and corresponding controls by empty curves. Percent positive cells, mean fluorescence intensity (MFI) and x-fold expression are shown in the upper right corner of each histogram. The x-fold expression is calculated by dividing the MFI of the positive sample with the MFI of the control. (B) For comparison, mDC of an HLA-A2- donor are transfected with 25 µg of 5 different species of HLA-A2 ivt-RNA. The quality of the standard poly-A tail (pAAA)-stabilized HLA-A2 ivt-RNA is compared with α-globin-stabilized (1, 2, 3) and β-globin-stabilized HLA-A2 ivt-RNA. The expression at different time points is depicted in a bar histogram as MFI. (C) mDC transfected with the various HLA-A2 ivt-RNA species are used 24 h after electroporation for co-incubation with the HLA-A2 allo-reactive CTL clone JB4 to assess their stimulatory capacity. IFNγ is quantified in culture supernatants by ELISA and presented as pg/ml. Mean values and mean deviations are derived from duplicate measurements.

An official website of the United States government
Here's how you know
Official websites use .gov
A
.gov website belongs to an official
government organization in the United States.
Secure .gov websites use HTTPS
A lock (
) or https:// means you've safely
connected to the .gov website. Share sensitive
information only on official, secure websites.
