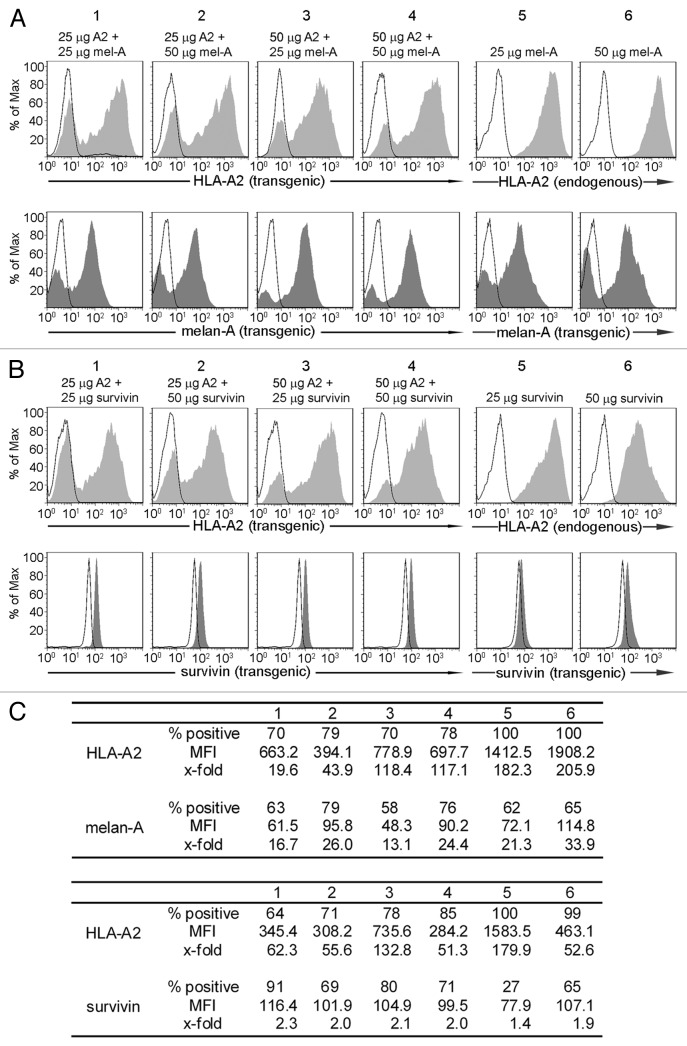
Figure 4. Co-expression of additional combinations of ivt-RNA encoding TAA and MHC. (A) mDC of an HLA-A2- donor are electroporated with four different RNA combinations: (1) 25 µg HLA-A2 and 25 µg melan-A ivt-RNA, (2) 25 µg HLA-A2 and 50 µg melan-A ivt-RNA, (3) 50 µg HLA-A2 and 25 µg melan-A ivt-RNA and (4) 50 µg HLA-A2 and 50 µg melan-A ivt-RNA. mDC of an HLA-A2+ donor are transfected with (5) 25 µg melan-A or (6) 50 µg melan-A ivt-RNA. Surface staining of HLA-A2 and intracellular staining of melan-A is performed 6 h after transfection and analyzed by flow cytometry. HLA-A2 expression is represented by filled curves in the upper panels; the corresponding melan-A expression of the same sample is shown beneath by filled curves. Corresponding controls are depicted in the respective histograms by open curves. (B) mDC of an HLA-A2- donor are electroporated with four different RNA combinations: (1) 25 µg HLA-A2 and 25 µg survivin ivt-RNA, (2) 25 µg HLA-A2 and 50 µg survivin ivt-RNA, (3) 50 µg HLA-A2 and 25 µg survivin ivt-RNA and (4) 50 µg HLA-A2 and 50 µg survivin ivt-RNA. DC of an HLA-A2+ donor are transfected with (5) 25 µg survivin or (6) 50 µg survivin ivt-RNA. Surface staining of HLA-A2 is performed 6 h and intracellular staining of survivin 3 h after transfection and analyzed by flow cytometry. HLA-A2 expression is represented by filled curves; corresponding survivin expression of the same sample is shown beneath by filled curves. Corresponding controls are depicted in the respective histograms by open curves. (C) The percent positive cells, MFI and x-fold expression of all stainings in (A and B) are shown.

An official website of the United States government
Here's how you know
Official websites use .gov
A
.gov website belongs to an official
government organization in the United States.
Secure .gov websites use HTTPS
A lock (
) or https:// means you've safely
connected to the .gov website. Share sensitive
information only on official, secure websites.
