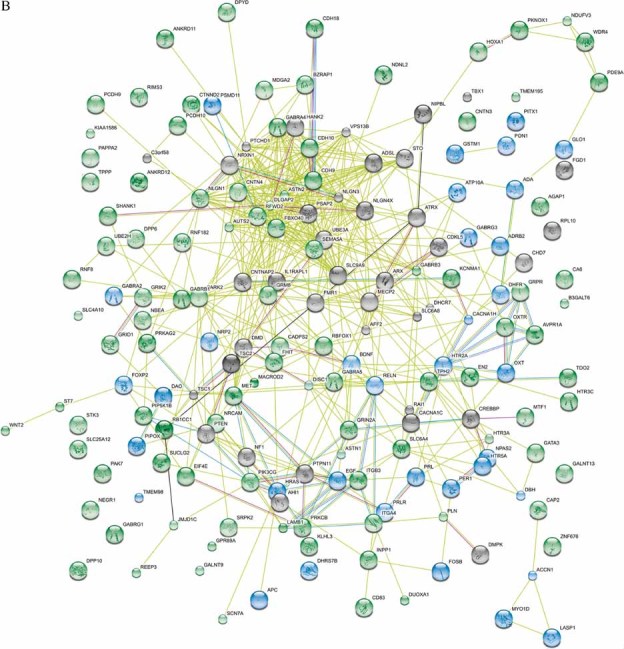
Network of known and predicted interactions between proteins encoded by genes implicated in ASD susceptibility produced by the Search Tool for the Retrieval of Interacting Genes/Proteins (STRING) 9.0 (
http://string.embl.de/) using default settings. Proteins are represented by spheres, the colours corresponding to the genes in (
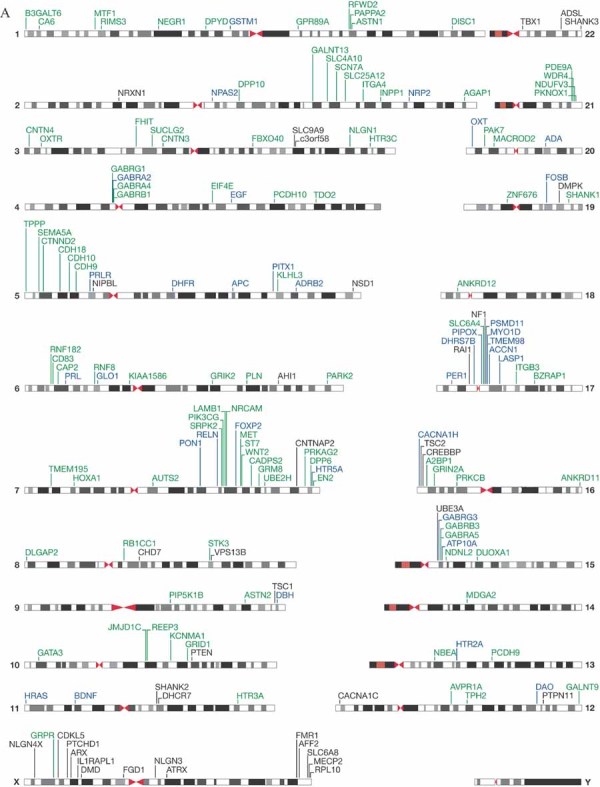
A) (protein names may differ from gene names, for example,
SHANK3 encodes PSAP2). Lines linking proteins indicate evidence for interactions; pale green = textmining, light blue = databases, pink = experimental, pale purple = homology, black = co-expression, bright green = neighbourhood (the genes reside within 300 bp on the same strand in the genome).