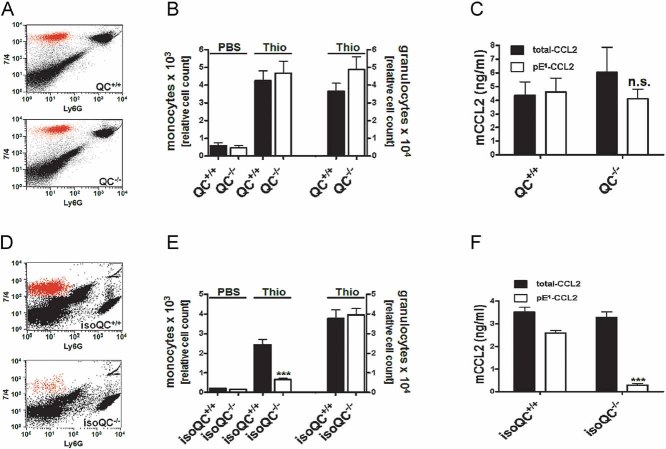
Representative FACS analysis showing the infiltrating monocyte population in QC+/+ and QC−/− mice dissected by specific staining.
Quantification of infiltrating monocytes and granulocytes in QC+/+ mice (black bars) and QC−/− mice (open bars; n = 8–13, mean ± SEM).
Lavage fluid from (B) was analyzed for total-CCL2 (black bars) and pE1-CCL2 (open bars; n.s., not significant, Student's t-test, mean ± SD).
Representative FACS analysis showing the infiltrating monocyte population in isoQC+/+ and isoQC−/− mice.
Quantification of infiltrating monocytes and granulocytes in isoQC+/+ mice (black bars) and isoQC−/− mice (open bars; ***p < 0.001 vs. isoQC+/+ Thio, Student's t-test, n = 10–14, mean ± SEM).
Lavage fluid from (E) was analyzed for total-CCL2 (black bars) and pE1-CCL2 (open bars; ***p < 0.001 vs. pE1-CCL2 from isoQC+/+ mice, Student's t-test, mean ± SD).

