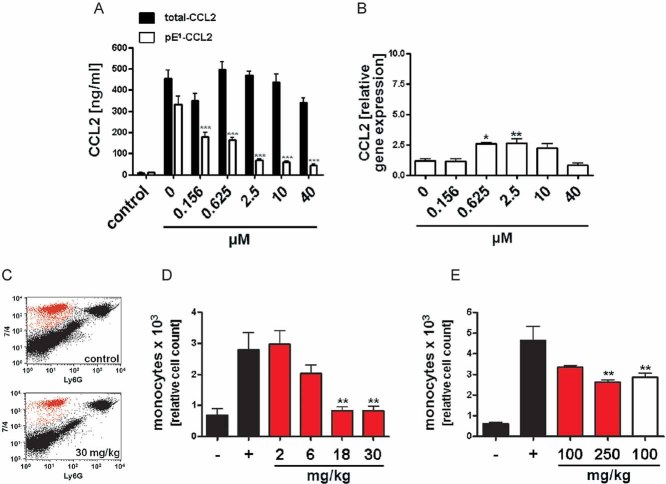
Analysis of total-CCL2 (black bars) and pE1-CCL2 (open bars) after application of varying doses PQ529 to LPS-stimulated primary murine glia cells isolated from C57BL/6J WT mice compared to unstimulated controls (***p < 0.001 vs. pE1-CCL2 (0 µM PQ529), ANOVA followed by Tukey post hoc test, n = 3–4, mean ± SEM).
Analysis of CCL2 gene expression in LPS-stimulated primary glia cells derived from
Fig 4A(*
p < 0.05, **
p < 0.01
vs. PQ529 0 µM, ANOVA followed by Tukey
post hoc test,
n = 3–4, mean ± SEM).
Representative FACS image showing the reduction of infiltrating monocytes after application of PQ529 (30 mg/kg, i.p.).
Dose-dependent reduction of infiltrating monocytes in absence (black bars) or presence (red bars) of intraperitoneal PQ529 treatment (**p < 0.01 vs. Thio (+), ANOVA followed by Tukey post hoc test, n = 5–6, mean ± SEM, female mice).
Inhibition of monocyte infiltration after oral application of PQ50 (red bars) and PQ529 (white bar; **p < 0.01 vs. Thio (+), ANOVA followed by Tukey post hoc test, n = 5–6, mean ± SEM, female mice).

