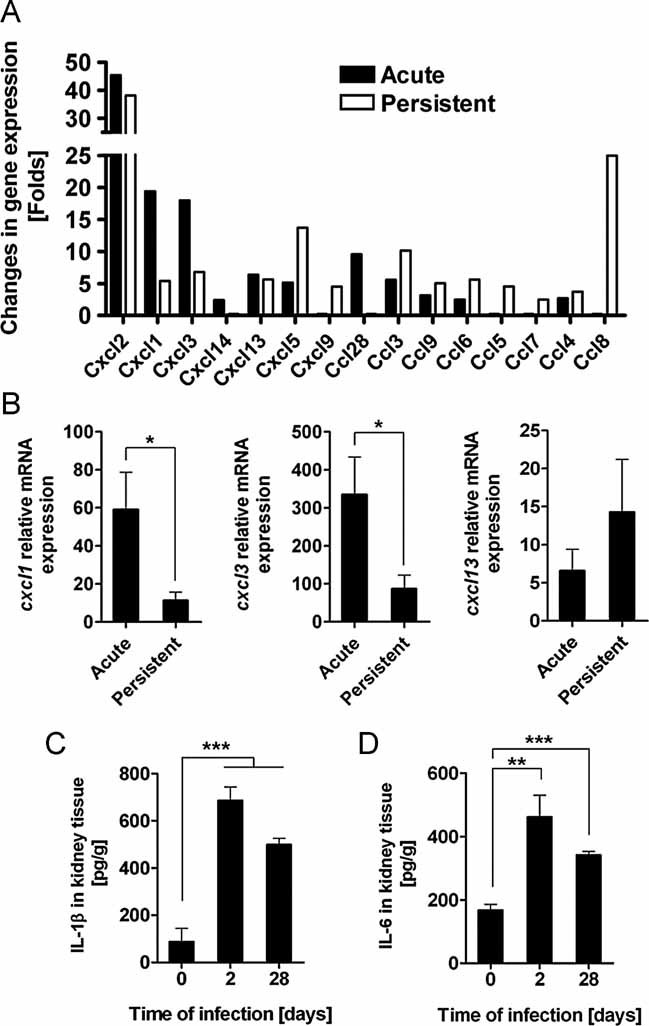
Figure 3. Expression patterns of chemokines and cytokines in the kidneys of S. aureus-infected mice.

- A. Transcriptional profiles of chemokines in kidneys isolated from S. aureus-infected mice during acute (2 days of infection; black bars) and persistent (28 days of infection; white bars) infection. Bars represent average fold change in gene expression of three independent microarrays per group relative to uninfected tissue.
- B. qPCR analysis of Cxcl1 (left panel), Cxcl3 (middle panel) and Cxcl13 (right panel) gene transcription in kidneys isolated from S. aureus-infected mice during acute or persistent infection. Values were calculated using the Pfaffl equation and expressed as a ratio of mRNA expression relative to β-actin. Each column represents the mean ± SD of samples obtained from three independent experiments. *p < 0.05.
- C,D. Levels of IL-1β (C) and IL-6 (D) in kidney homogenates prepared from S. aureus-infected mice before (day 0) and 2 and 28 days after S. aureus inoculation. The levels of IL-1β and IL-6 were determined by ELISA. Each column represents the mean ± SD of triplicate samples obtained from three independent experiments. **p < 0.01 and ***p < 0.001.
