
Figure 6. Negligible contribution of B cells to the control of S. aureus during a persistent infection.
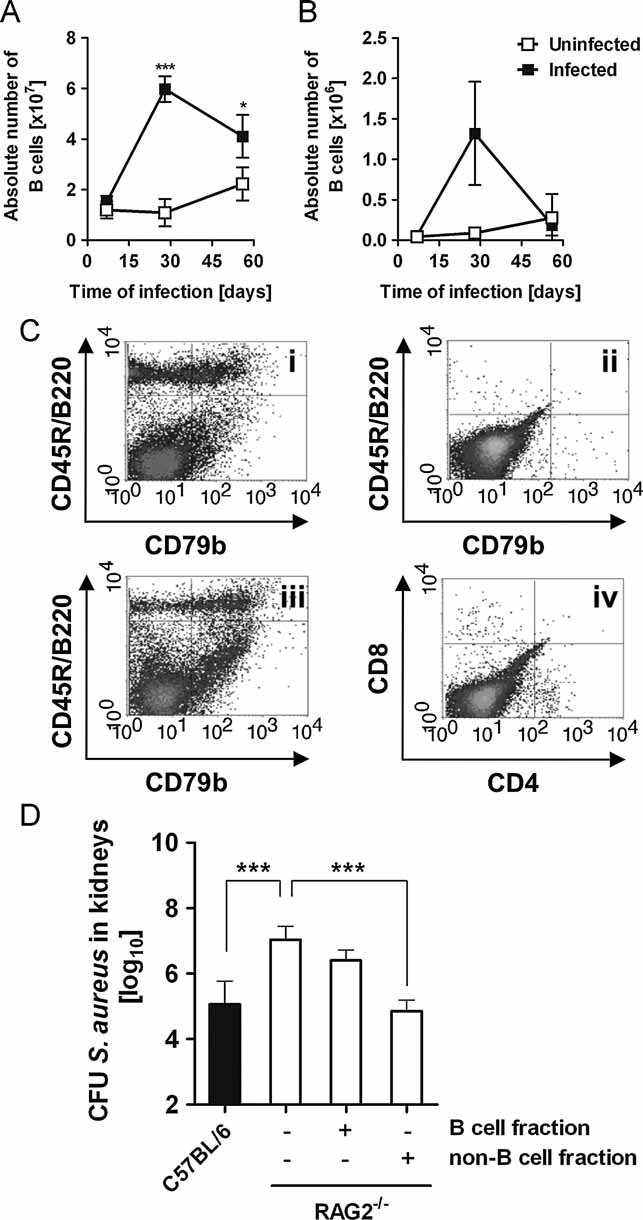
- A,B. Dynamics of B cells in the spleen (A) and peripheral lymph nodes (B) of uninfected (white symbols) or S. aureus-infected C57BL/6 mice (black symbols) at progressive times after bacterial inoculation as determined by flow cytometry analysis of CD45R/B220+ cells. Each symbol represents the mean ± SD of the absolute number of B cells determined in three animals. *p < 0.05 and ***p < 0.001.
- C. Dot plot flow cytometry analysis of splenic B cells (CD45R/B220+) from RAG2−/− mice prior (ii) and 56 days after (iii) reconstitution with app. 107 purified B cells isolated from the spleen of C57BL/6 donor (i) mice. Dot plot analysis of splenic CD4+ and CD8+ T cells from B cells-reconstituted RAG−/− mice is shown in (iv).
- D. Bacterial loads in the kidneys of C57BL/6 mice (black bar) and different groups of RAG2−/− mice (white bars), non-reconstituted or reconstituted with either purified B cells or with the non-B cell fraction at 56 days after intravenous inoculation with S. aureus. Bars represent the mean ± SD of four mice per group. One representative experiment of three independent experiments is presented. ***p < 0.001.