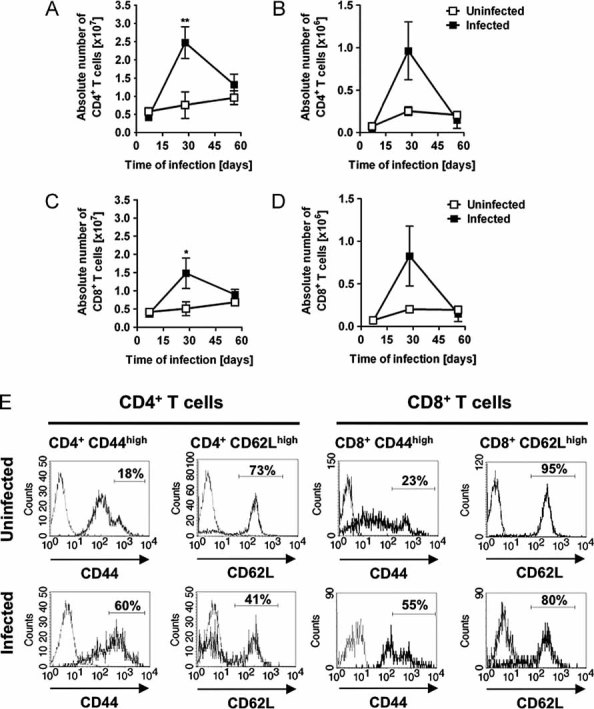
Figure 8. Dynamic and phenotype of T cells in S. aureus-infected C57BL/6 mice.

- A.–D. Absolute numbers of CD4+ T cells in the spleen (A) and peripheral lymph nodes (B) as well as CD8+ T cells in the spleen (C) and lymph nodes (D) of uninfected (white symbols) or S. aureus-infected (black symbols) C57BL/6 mice at progressive times after bacterial inoculation. Each symbol represents the mean ± SD of the absolute number of cells determined in three animals. *p < 0.05 and **p < 0.01.
- E. Gated CD4+ or CD8+ splenocytes from uninfected mice (upper panels) and from mice infected with S. aureus for 56 days (lower panels) were analysed for the expression of CD44 (left panels, thick lines) or CD62L (right panels, thick lines) by flow cytometry. Cells stained with isotype control antibodies (thin line) are included in each histogram. Numbers within histograms indicate mean % of CD4+ or CD8+ T cells expressing high levels of the corresponding marker.
