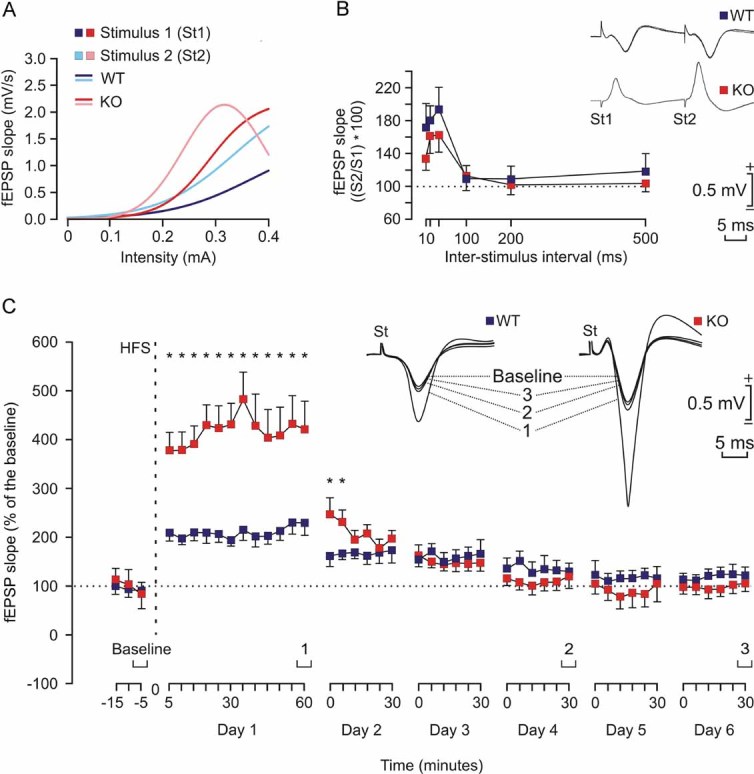
Input/output curves of fEPSPs evoked at the CA1 area by paired (40 ms of interval) pulses presented to Schaffer collaterals at increasing intensities (in mA) in WT (1st pulse, dark blue; 2nd pulse, light blue) and KO (1st pulse, dark red; 2nd pulse, light red) mice (n = 4 animals/group). The best nonlinear adjustments (r ≥ 0.99; p ≤ 0.001) to the collected data are illustrated. KO mice presented significantly larger (p < 0.01) input/output curves than WT animals.
There were no significant differences in paired-pulse facilitation between WT (blue) and KO (red) mice. The data shown are mean ± SEM slopes of the 2nd fEPSP expressed as a percentage of the 1st for six (10, 20, 40, 100, 200, 500) inter-pulse intervals. Some fEPSP paired traces (20 ms of inter-pulse interval) collected from representative WT and KO mice are illustrated.
The two graphs illustrate the time course of LTP evoked in the CA1 area (fEPSP mean ± SEM) following high frequency stimulation HFS for WT (blue) and KO (red) mice. The HFS was presented after 15 min of baseline recordings, at the time marked by the dashed line. LTP evolution was followed for up to 6 days. The fEPSP is given as a percentage of the baseline (100%) slope. Although the two groups presented a significant increase (ANOVA, two-tailed) in fEPSP slope following HFS when compared with baseline records, values collected from the KO group were significantly (*p < 0.001) larger than those collected from WT mice at the indicated times.