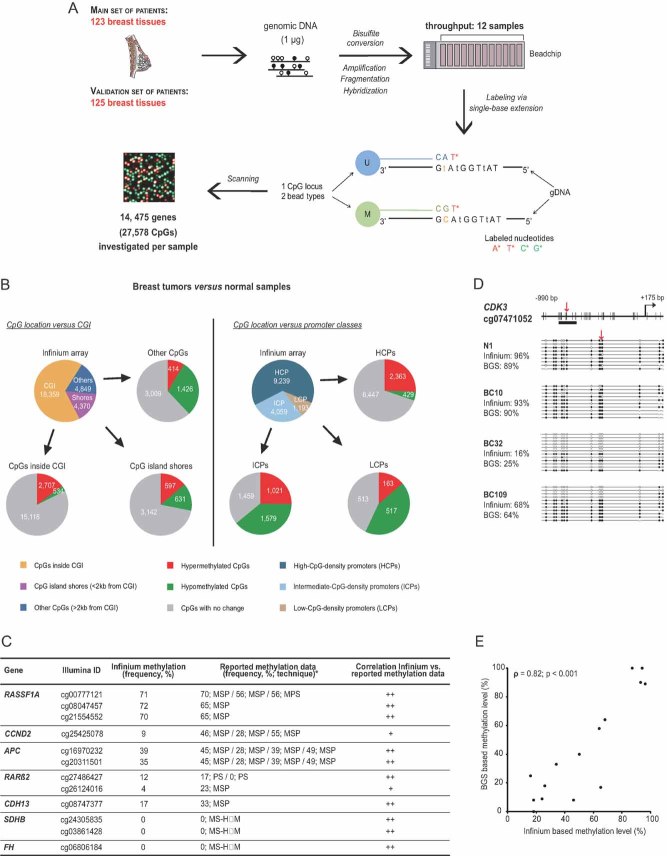
Figure 1. High-throughput DNA methylation profiling in human frozen breast tissues.
- A. Experimental outline for DNA methylation analysis of 248 breast tissues with the Infinium Methylation Assay.
- B. Pie chart depicting the number of CpGs differentially methylated between breast tumour and normal samples of the main set, in terms of: (i) CpG location vs. CGI (as defined in Bock et al, 2007) as well as CpG island shores (as defined in Irizarry et al, 2009); (ii) CpG location vs. promoter classes (as defined in Weber et al, 2007; see also Table SIII of Supporting Information).
- C. Methylation frequencies of representative CpGs examined by bead array and their correlation with previously reported data (see Table SIV of Supporting Information for a more detailes table with references).
- D, E. Validation of the bead array method by conventional Bisulphite Genomic Sequencing (BGS). Panel (D) shows an exemplative analysed locus, CDK3, in 1 normal (N1) and 3 tumour samples (BCs). Red arrows indicate the location of the CpG investigated by the bead array, which seems representative of the surrounding CpGs (see Fig S3 of Supporting Information for further examples). Data representation was done according to (Bock et al, 2005). Panel (E) shows a significant positive correlation (Spearman's rho = 0.82; p < 0.001) between the Infinium Methylation and BGS data.

