
Figure 4. The identified methylation patterns might be related to the cell type of origin of the tumours concerned.
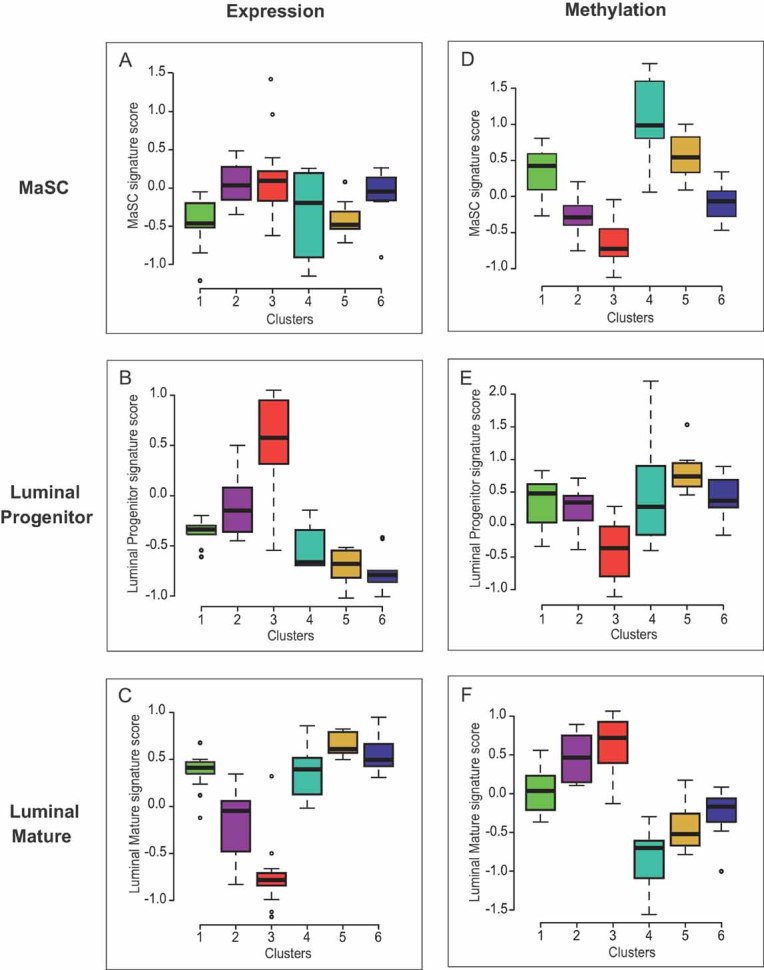
Comparison of gene expression signatures of several normal mammary epithelial subpopulations (Lim et al, 2009) with gene expression and DNA methylation profiles of our six DNA methylation-based groups of patients in the main set.
- A-C. Box plots of MaSC (A), luminal progenitor (B) and luminal mature (C) signature scores for each of the six methylation breast cancer groups, based on their gene expression profiles. Cluster 3 displayed the highest luminal progenitor signature score (p = 0.001 vs. clusters 2 and 4; p < 0.001 vs. other clusters; (B)), whereas the luminal mature signature score was higher for clusters 1, 4, 5 and 6 (p < 0.001 for each of these clusters vs. clusters 2 and 3, except for cluster 4 vs. cluster 2 where p = 0.019; (C)). Cluster 2 was not associated with any of the three signatures.
- D-F. Box plots of MaSC (D), luminal progenitor (E), and luminal mature (F) signature scores for each of the six methylation breast cancer groups, based on their DNA methylation profiles. A strong anti-correlation was observed between gene expression and DNA methylation data for the luminal progenitor and mature signatures (compare (E) with (B) and (F) with (C), respectively) (respective Pearson's coefficients: −0.59, p = 1.10−9 and −0.70, p = 6.10−14). It was weaker for the MaSC signature (compare (D) with (A); Pearson's coefficient: −0.47, p = 4.10−6).