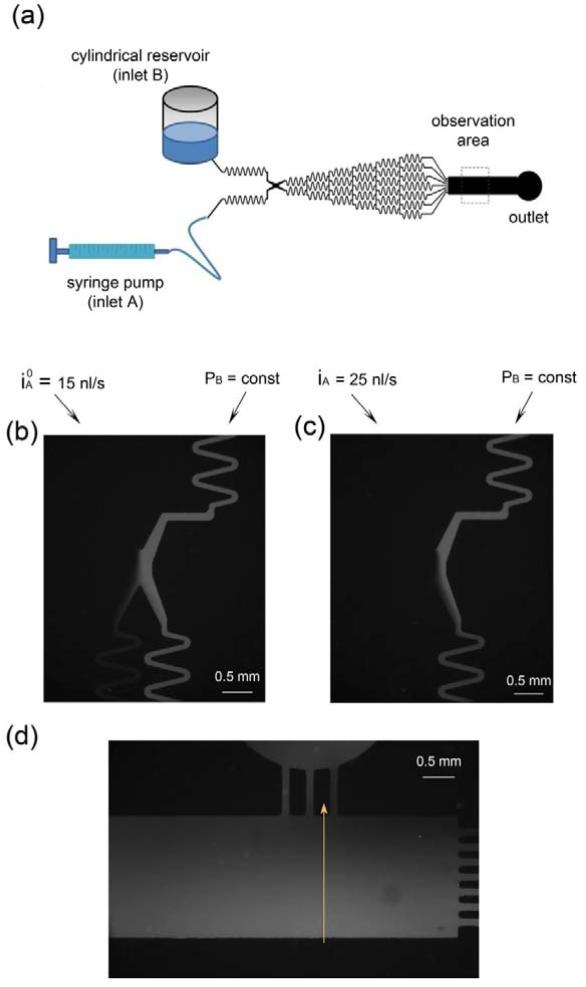
Figure 4.
Experimental validation of the concentration gradient generator. (a) A schematic of the experimental set-up to verify the concentration gradient. (b, c) Fluorescent micrographs around the equilibrium zone. Image (b) was used to determine the equilibrium flow rate and pressure. (d) A fluorescent micrograph in the cell culture and observation zone. The line is the place along which the fluorescent intensities are extracted to plot the intensity profiles in Fig. 5.

