
Figure 1. Crystal structure, stability and activity of the HSD10 homotetramer and mitochondrial morphology in fibroblasts from MHBDD patients.
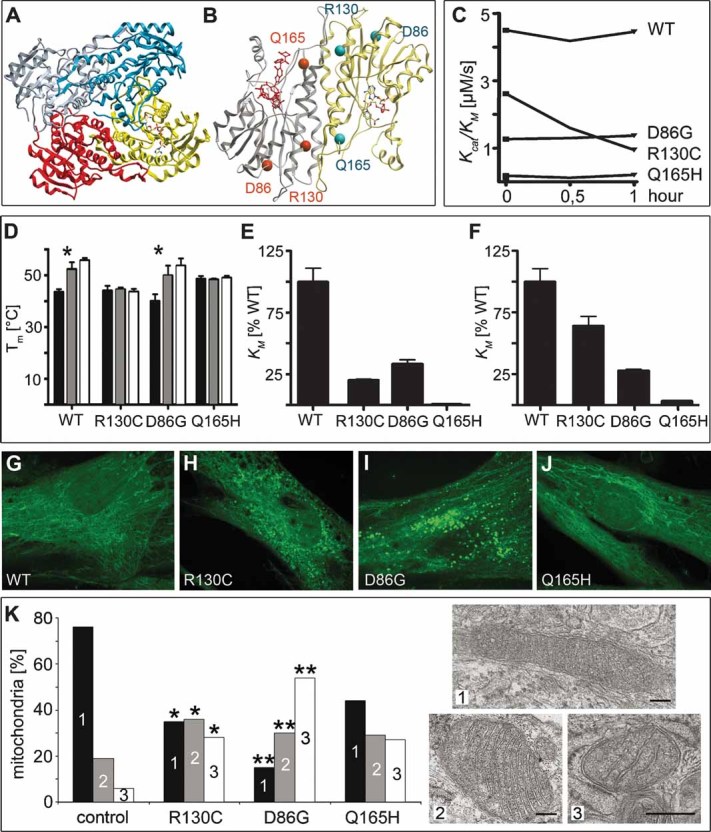
Crystal structure of HSD10. (A) Diagram of the homotetramer. A NADH cofactor is bound to one monomer. (B) Diagram of a HSD10 dimer with the location of the mutations. The active centre is marked by the substrate in red.
- C. Enzyme activity of HSD10 over time. Kcat/KM of HSD10 WT and mutations measured in a 30 min interval; substrate 2-methyl-3-hydroxybutyryl-CoA.
- D. Stability of HSD10 WT and mutations. Mean value of Tm determined by differential scanning fluorimetry (DSF)-experiments and standard deviation are shown. Black column: no cofactor/substrate, grey column: cofactor NAD+, white column: cofactor NADH (* indicates significant cofactor binding).
- E, F. Enzyme activity of HSD10 with different substrates. (E) Kcat/KM of HSD10 mutations with hydroxybutyryl-CoA as substrate (WT enzyme is taken as 100%). (F) Kcat/KM of HSD10 mutations with 2-methyl-3-hydroxybutyryl-CoA as substrate in relativity to the WT enzyme.
- G–J. Mitochondrial staining in patient fibroblasts. 300 nM Mitotracker Green FM were used on cells fixed with 3.7% formaldehyde on coverslips and mitochondria were visualized on a Perkin Elmer spinning disc confocal ERS-FRET on Nikon TE2000 inverted microscope. (G) Control, (H) R130C, (I) D86G, (J) Q165H.
- K. Fibroblasts were sectioned for electron microscopy. Pictures of 10–43 random systematically chosen visual fields were taken in a magnification of 11.5 × 10³, scale bars: 100 nm. Mitochondria were classified into three groups (1—dense, dark; 2—loosely packed; 3—depleted cristae) with group 3 not only being morphologically distinct but also characterized by smaller mitochondria. Total numbers per sample and an overview of the cells are given in Supporting Information Fig 3. ** Indicate significance at p < 0.0001, * gives significance at p = 0.0366–0.0857 adjusted for multiple comparisons within the experiment compared to control fibroblasts. Normal human dermal fibroblasts served as controls.