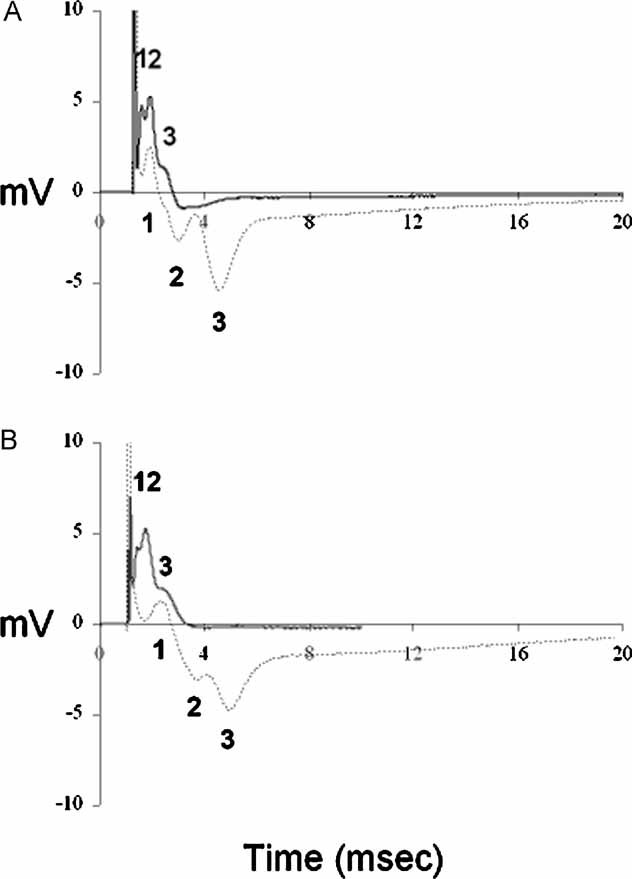
Figure 3. Electrophysiological recordings from WT and Plp1-transgenic optic nerves.

- Representative recordings from P40 WT (——) and Plp1-transgenic (——) mice. In WT mice, the CAP has the stereotyped triple-peaked profile that reflects populations of axons with different conduction velocities. The CAP recorded from Plp1-transgenic mice resolved into three peaks, but the duration of the CAP was longer than that of the control (6 ms vs. 3 ms) signifying a decrease in the conduction velocity.
- Representative recordings from P120 WT (——) and Plp1-transgenic (——) mice. The CAP recorded from P120 Plp1-transgenic mice was similar to that of the P40 transgenic animals, but the peaks were less well defined and their amplitudes were smaller. A total of 10 WT and 10 Plp1-transgenic nerves were examined.
