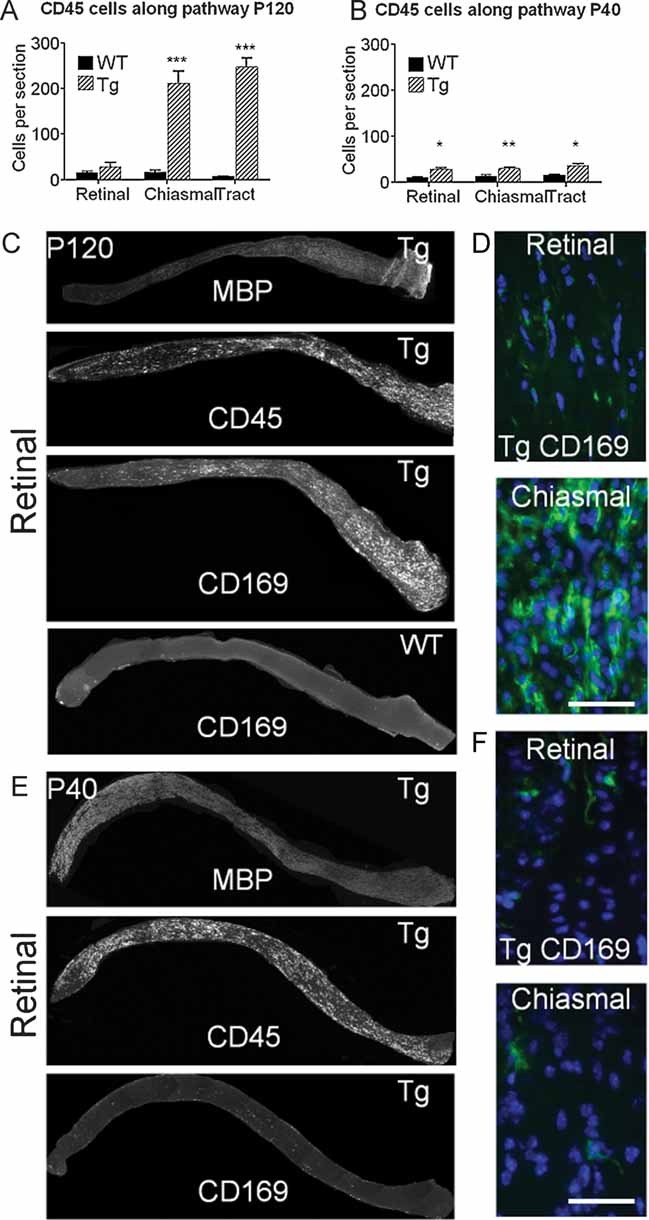
CD45+ cell numbers along the optic pathway of WT and Plp1-transgenic (Tg) mice aged P120. Whereas the demyelinated retinal region has no increase in these cells there is a massive increase in the actively demyelinating distal regions of the nerve.
At P40, prior to overt demyelination, the CD45+ cell numbers are similar along the entire pathway. The increased number, relative to WT, reflects the developmental dysmyelination.
Longitudinal sections of optic nerve from the retinal end (left) to the chiasm from a Plp1-transgenic (Tg) mouse aged P120 immunostained for MBP, CD45 and CD169, showing the gradient in myelin and macrophages between the two ends of the optic nerve. Only CD169 is shown for the WT mouse.
Enlarged images from the retinal and chiasmal ends of the optic nerve from the Plp1-transgenic mouse illustrate the marked difference in the densities of CD169+ cells between the two sites.
Longitudinal sections of optic nerve, as for C, from a Plp1-transgenic (#72) aged P40. MBP immunoreactivity shows that the entire length of the nerve (except the unmyelinated lamina cibrossa) is myelinated at this age. Although CD45+ cells are present along the nerve, very few CD169+ cells are evident.
Enlarged images from the retinal and chiasmal ends of the optic nerve from the Plp1-transgenic (#72) mouse illustrating the scarcity of CD169+ cells prior to overt demyelination. Bar = 50 µm.