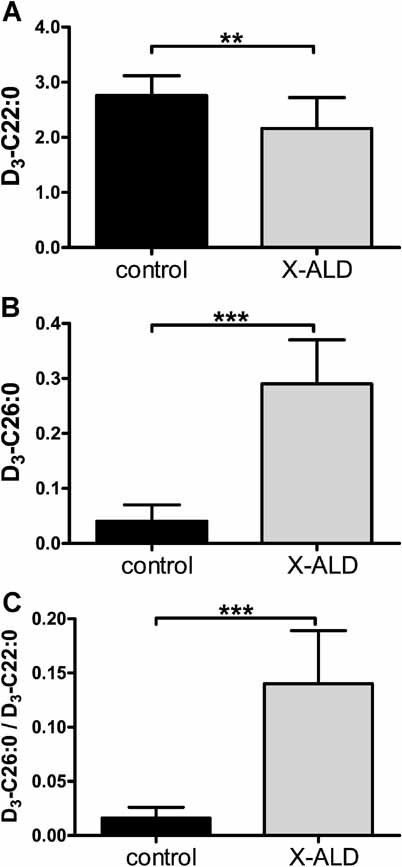
Figure 1. D3-VLCFA levels in control and X-ALD fibroblasts.

- D3-C22:0 levels in control versus X-ALD cell lines.
- D3-C26:0 levels in control versus X-ALD cell lines.
-
D3-C26:0/D3-C22:0 ratio in control versus X-ALD cell lines.Eight control and 25 X-ALD cell lines were cultured for 72 h with 50 µM D3-C16:0. Fatty acids are in nmol/mg protein. Data are mean ± SD. **p < 0.01, ***p < 0.001 by unpaired student's t-test.
