
Figure 7. HER2 tumours exhibit high content of myofibroblasts and display a stress response signature.
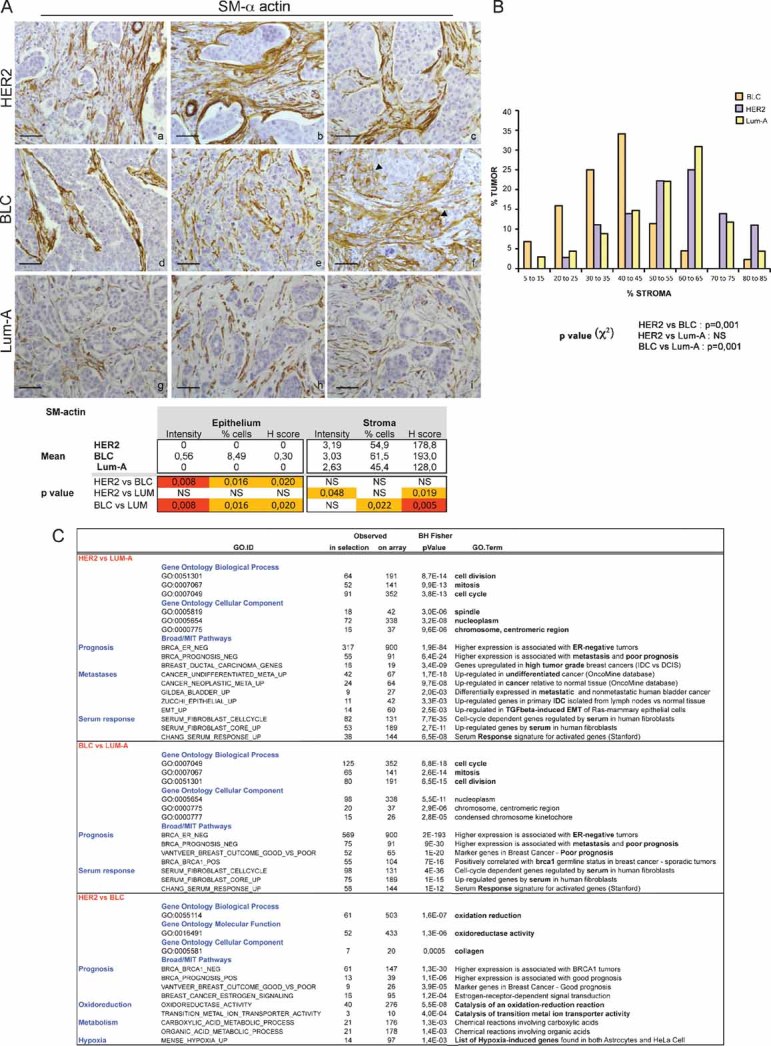
- Representative staining of SM-α-actin in HER2 (a–c), BLC (d–f) and Lum-A (g–i) human breast tumours. Arrowheads indicate SM-α-actin staining in epithelial cells in BLC (f). p-values are as in Fig 6.
- Representative graph of the percentage of fibroblasts compared to total cells forming the tumour in each breast cancer subtype. p-values by χ2 test are highly significant between BLC and HER2 or Lum-A (≤0.001) and non-significant between HER2 and Lum-A.
- Gene Ontology pathways significantly at least 2-fold up-regulated in HER2 versus Lum-A, BLC versus Lum-A and HER2 versus BLC, as indicated. p-values by Fisher Exact test adjusted using the Benjamini–Hochberg correction are indicated.