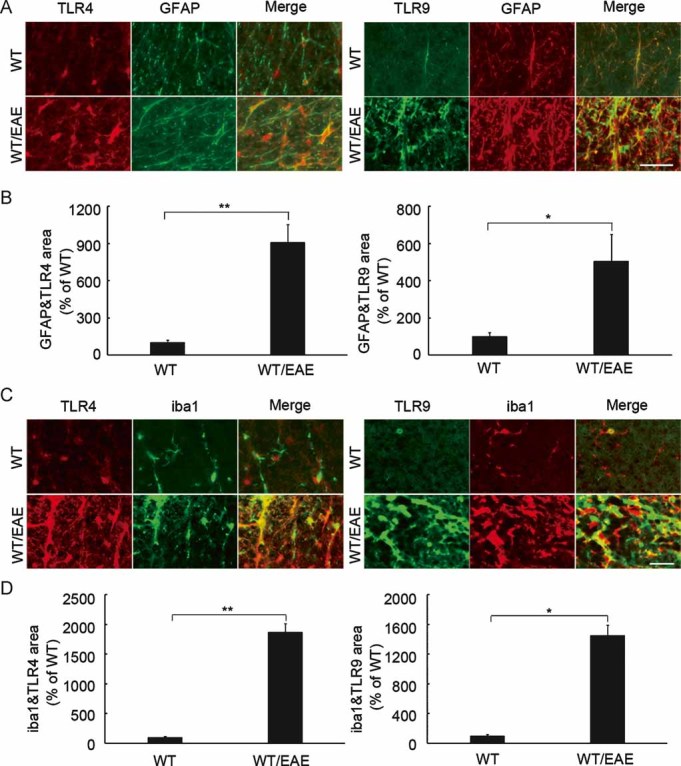
Figure 3. TLR upregulation in glial cells in EAE.

- Representative double-labelling immunohistochemistry for TLR4 or TLR9 with GFAP in the white matter of the spinal cord. Scale bar: 30 µm.
- Quantification of the double-stained areas per unit area (0.048 mm2) in (A). The results are expressed as percentages of the wild-type non-EAE (WT) mice (n = 4). **p < 0.001; *p < 0.01.
- Representative double-labelling immunohistochemistry for TLR4 or TLR9 with iba1 in the white matter of the spinal cord. Scale bar: 30 µm.
- Quantification of the double-stained areas per unit area (0.048 mm2) in (C). The results are expressed as percentages of the wild-type non-EAE (WT) mice (n = 4). **p < 0.001; *p < 0.01.
