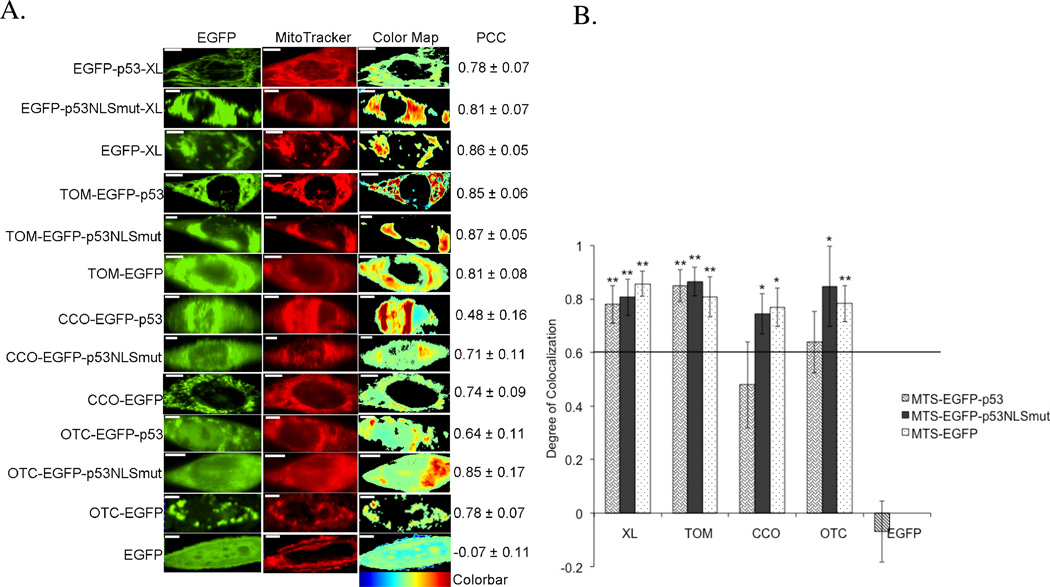
Figure 2.
Colocalization of MTS constructs and MitoTracker Red mitochondrial stain in 1471.1 cells. A) Representative images of MTS-EGFP-p53, MTS-EGFP-p53 NLS mutation, MTS-EGFP and EGFP-C1 are shown in the left column with images of MitoTracker Red distribution in the middle column. The ‘EGFP’ and ‘MitoTracker’ columns have been false colored green and red, respectively. Enhanced visualization of colocalized pixels is rendered in the ‘Color Map’ column. Warm colors depict pixels with highly correlated intensity and spatial overlap while cool colors are indicative of anti- or random correlation (colorbar for interpretation is shown below column). Corresponding PCC values are shown in the right column. White scale bars are all 10 µm. B) The degree of colocalization is represented by PCC following Costes’ approach. 38, 39 All constructs with values higher than 0.6 are considered highly colocalized with mitochondrial stain MitoTracker Red. Statistical analysis was performed by using odds ratio with Pearson’s Chi-square. The adjusted odds ratio for PCC value of 0.6 were compared with each sample. *p<0.05, and **p<0.01 comparing odds ratio of lowest value for samples with odds ratio of 1 for PCC of 0.6.

