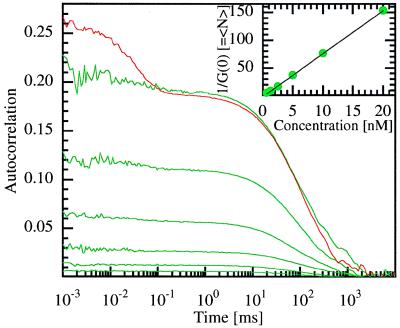
Figure 2.
Fluorescence autocorrelation functions as a function of time. Data were obtained from several different concentrations of rhodamine 6G (R6G) molecules in 70% sucrose aqueous solution. The concentrations used are (green curves, from the bottom): 20 nM, 10 nM, 5 nM, 2.5 nM, 1.25 nM, and 0.62 nM. The autocorrelation decays at a time scale of ≈100 ms due to diffusion of molecules in and out of the excitation volume. (Inset) Average number 〈N〉 of molecules in the focal volume (as determined by the inverse of the value of the autocorrelation function extrapolated to time zero [1/G(0)]) as a function of concentration. The topmost curve (red) is also obtained from 0.62 nM R6G, but at 70 times higher excitation power. Lowering of the molecular ground state population by long-lived triplet excited state formation is evident in the higher G(0), while the triplet state lifetime manifests itself in the sub-millisecond decay of the extra part of the autocorrelation.

