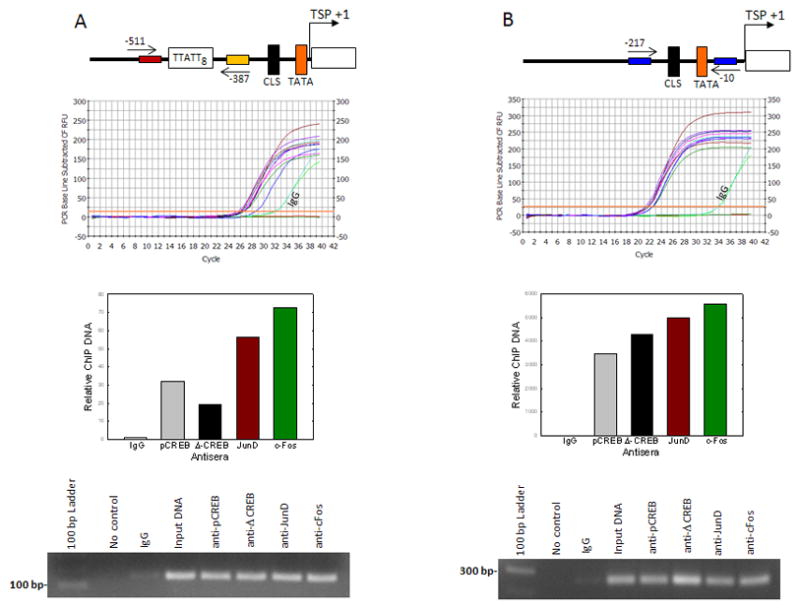
Fig. 8.

In situ association of CREB, c-Fos, and JunD proteins with the Aanat promoter region containing TTATT8 and CLS cis-elements. Retinal cells were treated for 6 hrs with forskolin (10 μM) and then incubated with 1% formaldehyde to cross-link endogenous proteins and DNA. Upper panels: Illustration of Aanat promoter region amplified for ChIP assay. Arrows mark the location of primers used to amplify Aanat promoter region. The relative positions of TTATT8, CLS, and TATA in the Aanat promoter region is shown (A-B). Middle panels: Cellular DNA fragments were immunoprecipitated with anti-pCREB, anti-Δ–CREB, anti-JunD, anti-c-Fos, or normal IgG, and DNA fragments spanning −511 to −367 bp (A) and −217 to −10 (B), encompassing the TTATT8 and CLS respectively, were amplified by qPCR. Primer pairs against Aanat promoter were used in Input control (diluted 1:10), and the primers without ChIP DNA were used as a ‘no DNA control’ (A–B). The histograms represent relative quantity of DNA immunoprecipitated by specific antibodies normalized to that recovered with normal IgG, as measured by ΔΔCt (lower-middle panels); IgG values were set to 1. Lower panels: PCR products were run in 1% agarose gel (A–B). For further details see Materials and Methods.
