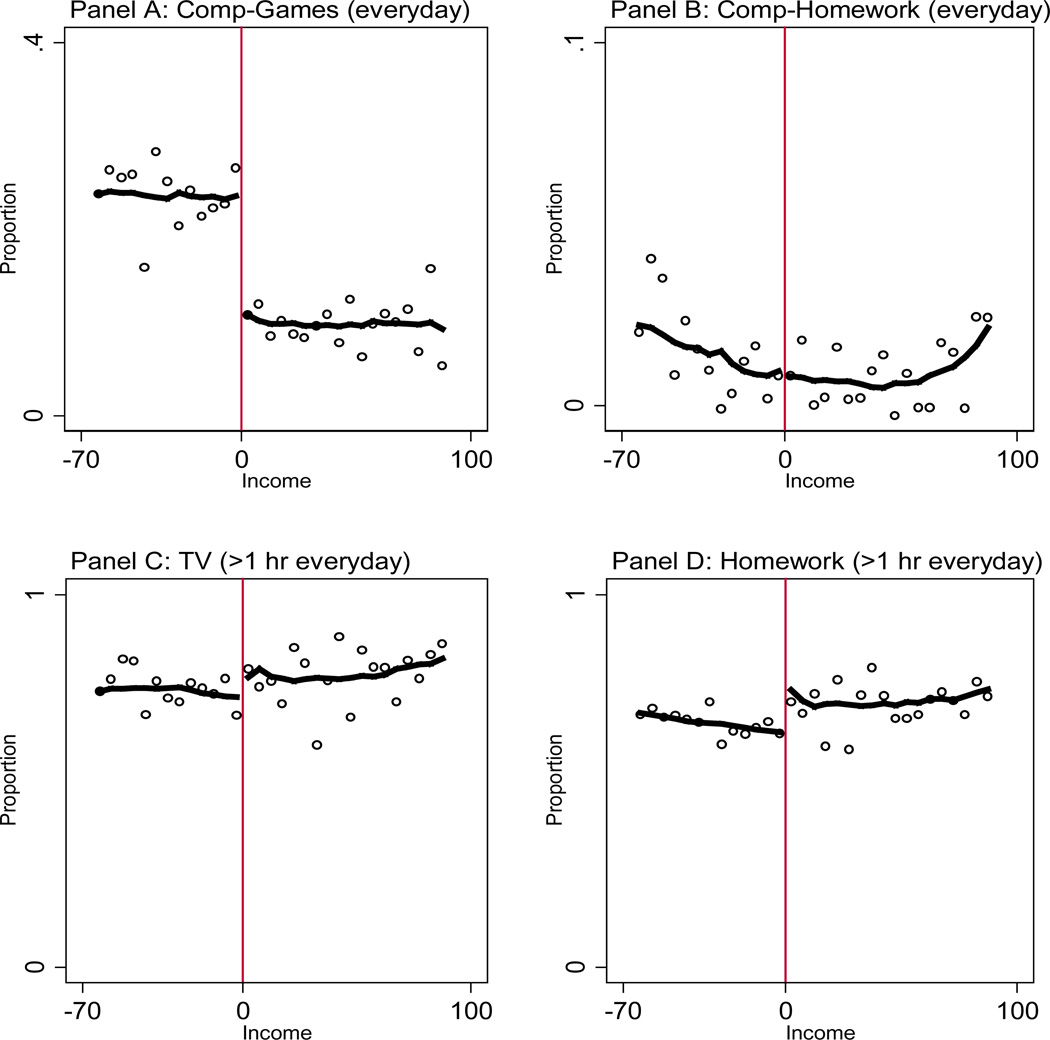
Figure II. Time Use.
Notes: The dependent variables are defined in Tables I, II, and III. The open circles plot the residuals from regressions of the dependent variables on our standard set of controls for 5 RON intervals. The solid lines are fitted values of residuals from local linear regressions of the dependent variable using a rectangular kernel with a bandwidth of 30. The income variable is the monthly household income per family member used by the Euro 200 program and is normalized to be 0 at the 62.58 RON cutoff. Source: 2009 Euro 200 Survey.

