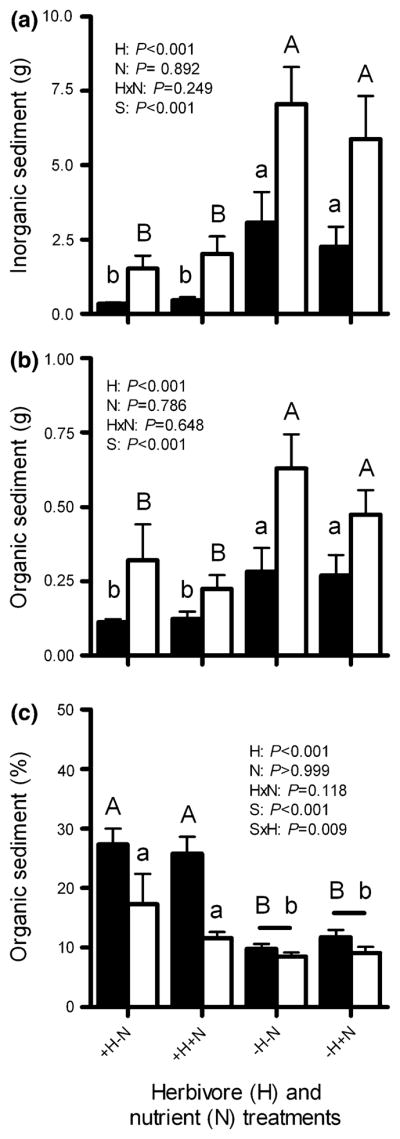
Fig. 3.

a Inorganic and b organic sediments (grams per 800 cm2, mean + SE), or c percent (mean + SE) of total sediments that are organic on settlement blocks accessible (+H) or inaccessible (−H) to herbivores, both without (−N) and with (+N) nutrient enrichment, when deployed on a protected reef (MPA; black bars) or on an adjacent fished reef (non-MPA; white bars) for 152 days (n = 10 per treatment per site). P values are from three-factor analyses of variance (ANOVA) of rank-transformed data. See Table 2 for complete ANOVA results. Letters indicate significant groupings by Tukey multiple comparisons tests. Horizontal bars indicate non-significant differences between sites (S), within a treatment. Upper and lower case letters distinguish within-site contrasts among treatments. Note scale differences on y-axis
