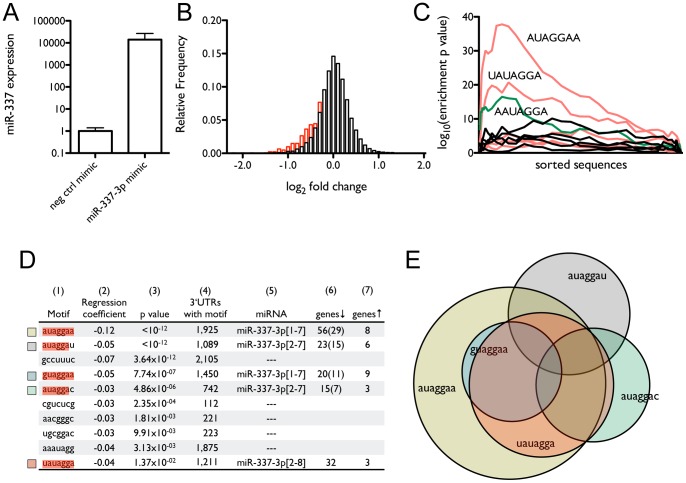
Figure 2. Predicted targets of miR-337-3p decrease in mRNA expression on over-expression of miR-337-3p.
(A) Expression levels of miR-337-3p after 72 h transfection of NCI-H1155 cells with 50 nM miR-337-3p mimic as measured by qRT-PCR. (B) Histogram of changes in mRNA expression level as a function of miR-337-3p over-expression. The bars in black show relative frequencies of observed log2 fold changes for all genes, while the bars in red show the distribution for genes with 3′UTRs containing at least one 7-mer corresponding to the miR-337-3p seed region. (C) The significance landscape plot for 7-mers across all genes, sorted by change in expression, from most decreased to most increased, showing 7-mers that are highly enriched in the 3′UTRs of genes that are decreased in expression. (D) Correlation between mRNA expression and motif content of 3′UTRs induced by miR-337-3p over-expression. Shown are: (1) the 7-mer motif, highlighted to show complementarity to miR-337-3p, (2) the regression coefficient, (3) the p value, (4) the number of genes containing the motif, (5) the miRNA to which the motif corresponds, with the nucleotide positions fully complementary to the highlighted sequences in column 1 shown in brackets, and the number of genes that (6) decrease in expression or (7) increase in expression by ≥2-fold. In column 6, the number of genes that contain the listed motif, but do not contain the canonical miR-337-3p seed sequence target, is given in parentheses. (E) Proportional Venn diagram showing the relationship among the genes that decrease ≥2 fold in expression and contain one or more of the five 7-mers corresponding to the mature miR-337-3p sequences.

