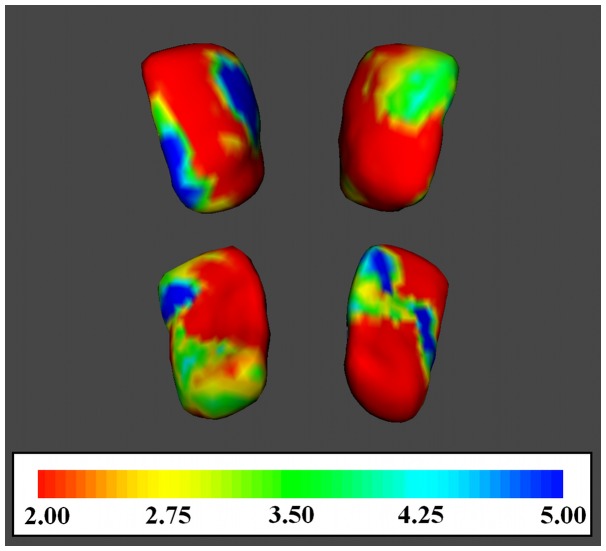
Figure 2. Vertex-wise comparison of the nucleus accumbens between healthy controls and Psychogenic ED patients.
For vertex-wise shape analysis F-statistics have degrees of freedom of 1,40 giving p=0.165 (F=2), p=0.105 (F=2.75), p=0.086 (F=3.50), p=0.045 (F=4.25), p=0.030 (F=5). Family-wise error rate is controlled. Images are oriented according to neurological convention (the right hemisphere of the brain corresponds to the right side of the image).

