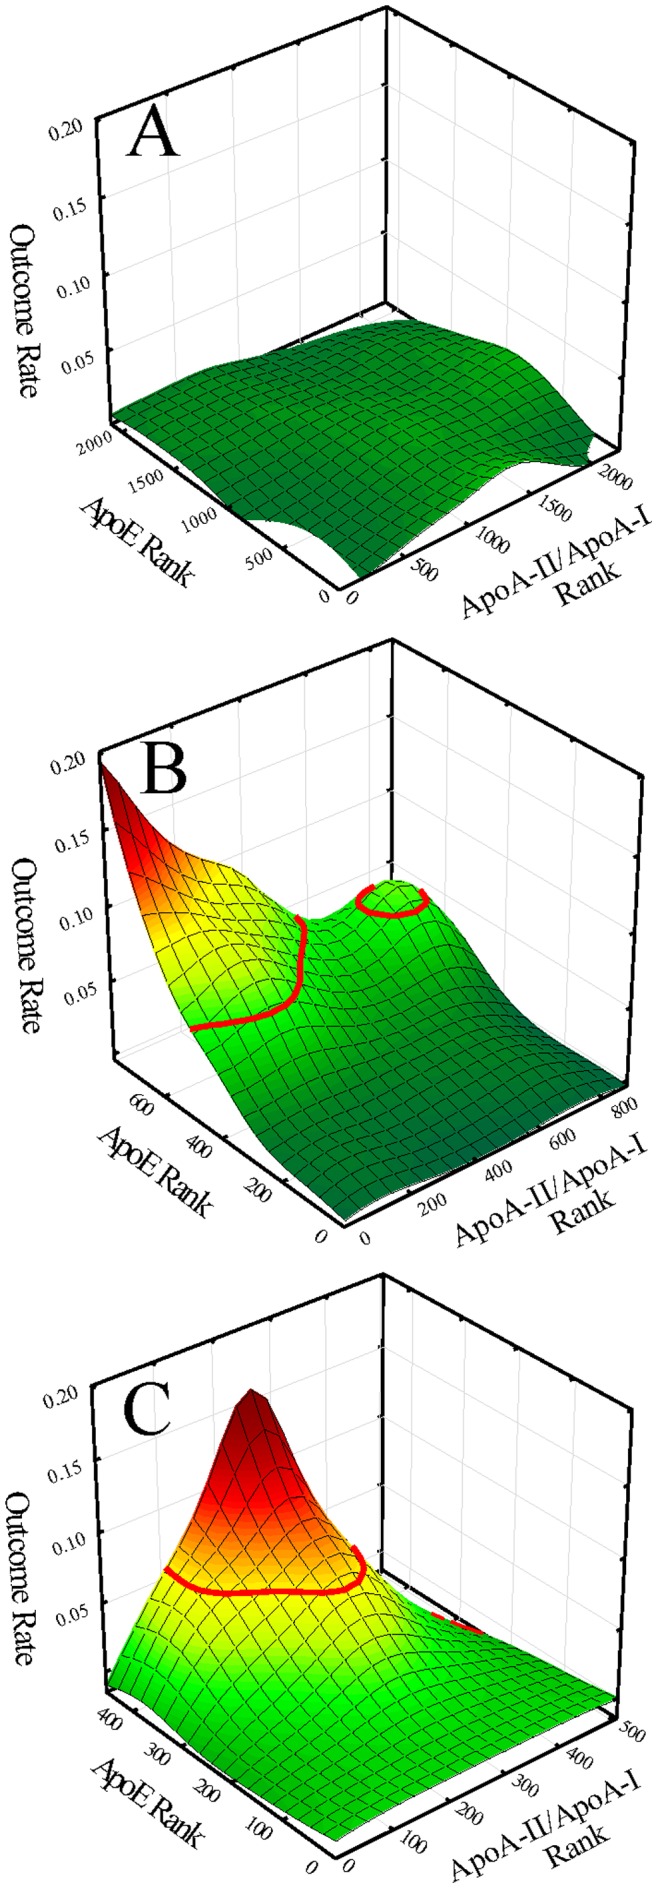
Figure 3. Outcome event maps as a function of apoA-II/apoA-I ratio and apoE ranks in women for: A. the background subgroup (BG); B. the low HDL-C/high CRP subgroup (HR1) with iso-contour line of risk at 5.3% superimposed; and C. the high HDL-C/high CRP subgroup (HR2) with iso-contour line of risk at 5.3% superimposed.