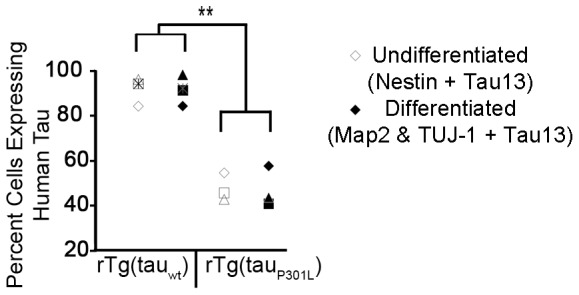
Figure 7. The proportion of differentiated cells that expressed human tau reflected that of undifferentiated neurospheres.

Differentiated cells immunoreactive with both Map2 and TUJ-1 antibodies were counted; the proportion co-expressing Tau13 is presented here. Presented are results from four independent rTg(tauwt) cultures and three independent rTg(tauP301L) cultures generated from two litters of each Tg(CK-tTA) × TRE-tau mating. The four litters were harvested, genotyped, and cultured simultaneous. They yielded four rTg(tauwt) and three rTg(tauP301L) pups for neurosphere culture shown here. By ANOVA, the proportions of differentiated cells (closed symbols) did not differ from those of the neurospheres (open symbols) (ANOVA, F = .008, P = .93). The different symbols represent individual cell lines before and after differentiation. Genotype had a highly significant effect even after Bonferroni correction (**: ANOVA, p<0.0001).
