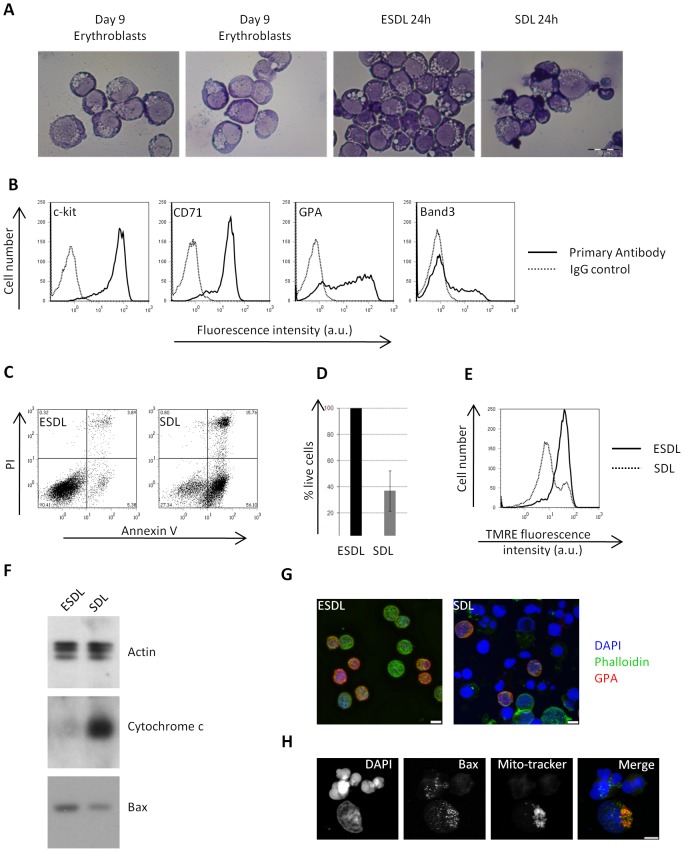
Figure 1. Epo removal induces apoptosis of erythroblasts.
A) Cytospins of 2 separate erythroblast cultures obtained after 9 days in culture in ESDL medium and of erythroblasts after 24 hour in ESDL or SDL (scale bar is 20 µM). B) Flow cytometry analysis of cell surface markers expressed by erythroblasts after 8 days in culture in ESDL medium. FL2 fluorescence (x axis) versus cell number (y axis) of cells labelled with the isotype control antibody (dotted grey line) and antibodies against CD117/c-kit, CD71, GPA (BRIC256) and Band 3 (BRIC6) (thick black line). C) Flow cytometry analysis of Annexin V (FL1) and Propidium Iodide (PI, FL3) labelling of erythroblasts kept for 24 hour in ESDL or SDL. In this representative experiment, 90% of the cells kept in ESDL are alive (Annexin V and PI negative) compared to only 28% in SDL. D) Graph showing the average percentage of live erythroblasts kept for 24 hour in ESDL or SDL, normalised to the percentage of live cells in ESDL. After 24 hour, only 37% of the cells in SDL are live (AnV/PI negative, with a standard deviation of +/−15%, n = 15). E) Flow cytometry analysis of mitochondrial membrane potential (ΔΨ) using TMRE. In this representative experiment, the FL2 fluorescence for erythroblasts cultured for 24 hour in ESDL (thick black line) is overlayed with that of cells cultured for 24 hour in SDL (dotted grey line). The loss of TMRE fluorescence indicates a loss of mitochondrial membrane potential (ΔΨ). F) Cytochrome C release into the cytosol. Western blots against cytochrome c and total Bax were carried out on the cytosolic fraction depleted of all organelles, obtained from erythroblasts kept for 24 hour in ESDL or SDL. Beta actin was used as a loading control. G) Overlay projections of confocal images taken from erythroblasts grown for 24 hour in ESDL or SDL (blue: DAPI; green: 488 Phalloidin; red: GPA) showing that cells cultured for 24 hour in the absence of Epo have lost their plasma membrane integrity and have fragmented nuclei. H) Translocation of Bax to the mitochondria in cells kept for 24 hour in SDL. Overlay projections of confocal images taken from erythroblasts grown for 24 hour in SDL (blue: DAPI; green: Bax; red: Mito-tracker). Scale bar on images represents 5 µm.

