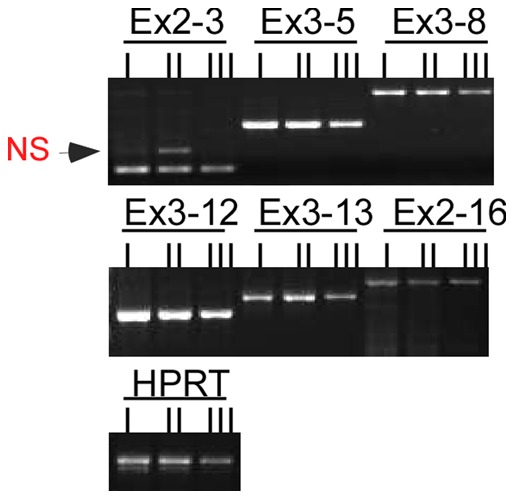
Figure 5. Expression of gp96MD is not due to a basophil-specific alternative splicing.

Exon (Ex)-specific PCR analysis of gp96 cDNA from sorted populations of bone marrow cells. (Ex2-3, Ex3-5, Ex3-8, et al. indicates the amplified fragments between different exons; NS: non-specific band). Population I: B220−IgGhigh, Population II: B220+IgGhigh, Population III: B220+IgG−.
