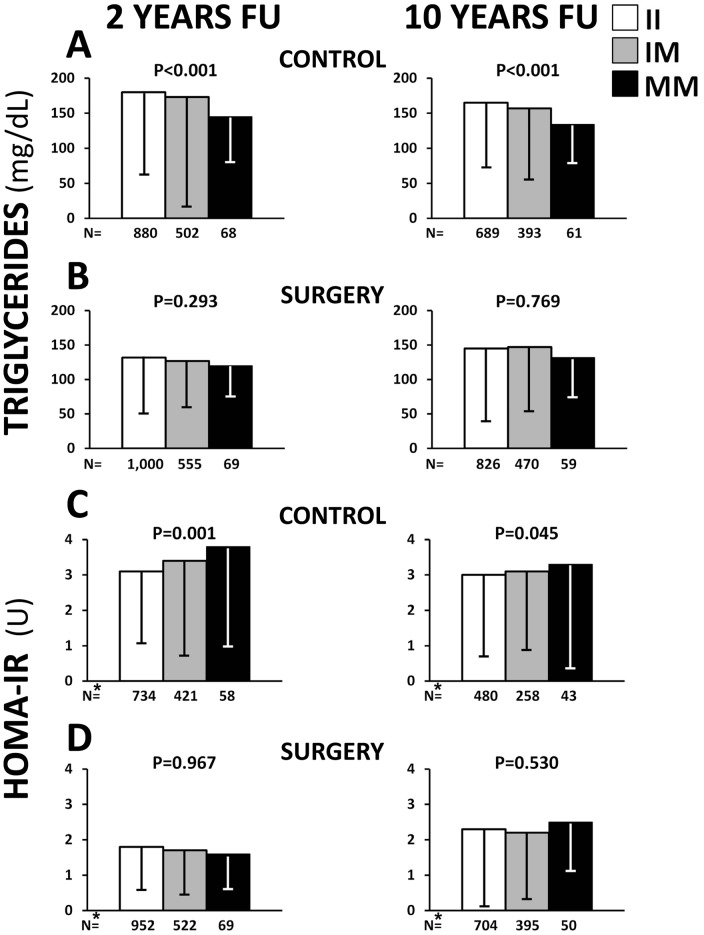
Figure 2. Serum triglycerides and homeostasis model assessment for insulin resistance (HOMA-IR) at 2- and 10-year follow-up.
Serum triglycerides (panel A and B) levels and HOMA-IR (panel C and D) at 2- and 10- year follow up (FU) in the control (A, C) and the surgery (B, D) group across the PNPLA3 genotypes. Values are means and standard deviations. * HOMA-IR values are shown only in non-diabetic individuals.

