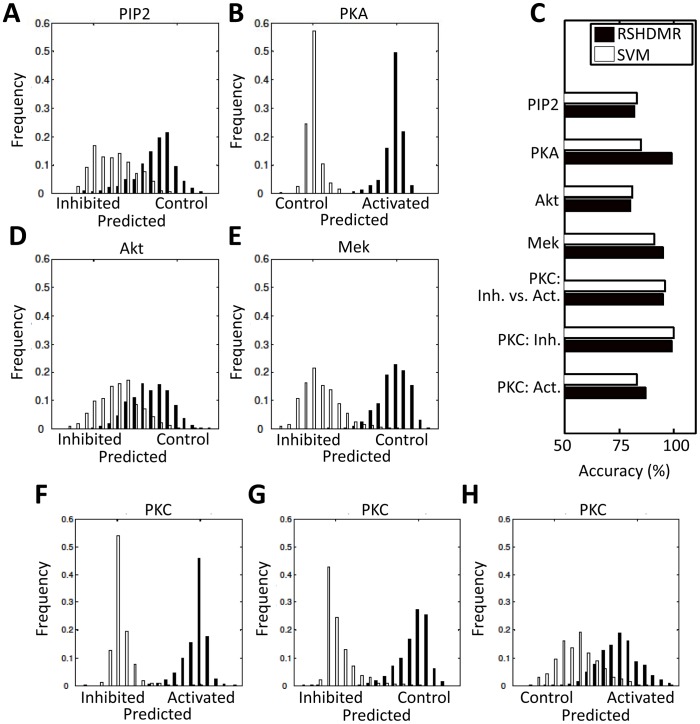
Figure 5. Inverse FEOMs Infer Experimental Conditions.
Inverse FEOMs were constructed between data sets describing the network under general stimulatory (“Control”) and specifically perturbative (“Activated” or “Inhibited”) experimental conditions. The perturbed node was used as the output, whose values were digitized according to experimental conditions, being either relatively high (1) shown in black or low (0) shown in white. (A–B, D–H) These histograms describe RS-HDMR-fitting ability for data observed under activating or inhibiting conditions. Although the experimental perturbations are approximated as discrete, RS-HDMR expresses the model output as continuous, thus the distribution of RS-HDMR fitted results approximately resembles two Gaussian distributions. Clear separation of the two distributions for a given plot indicates good RS-HDMR prediction of the corresponding perturbation. (C) Inverse FEOM accuracy using a SVM classifier and RS-HDMR. RS-HDMR accuracy corresponds to histograms in A–B, D–H.

