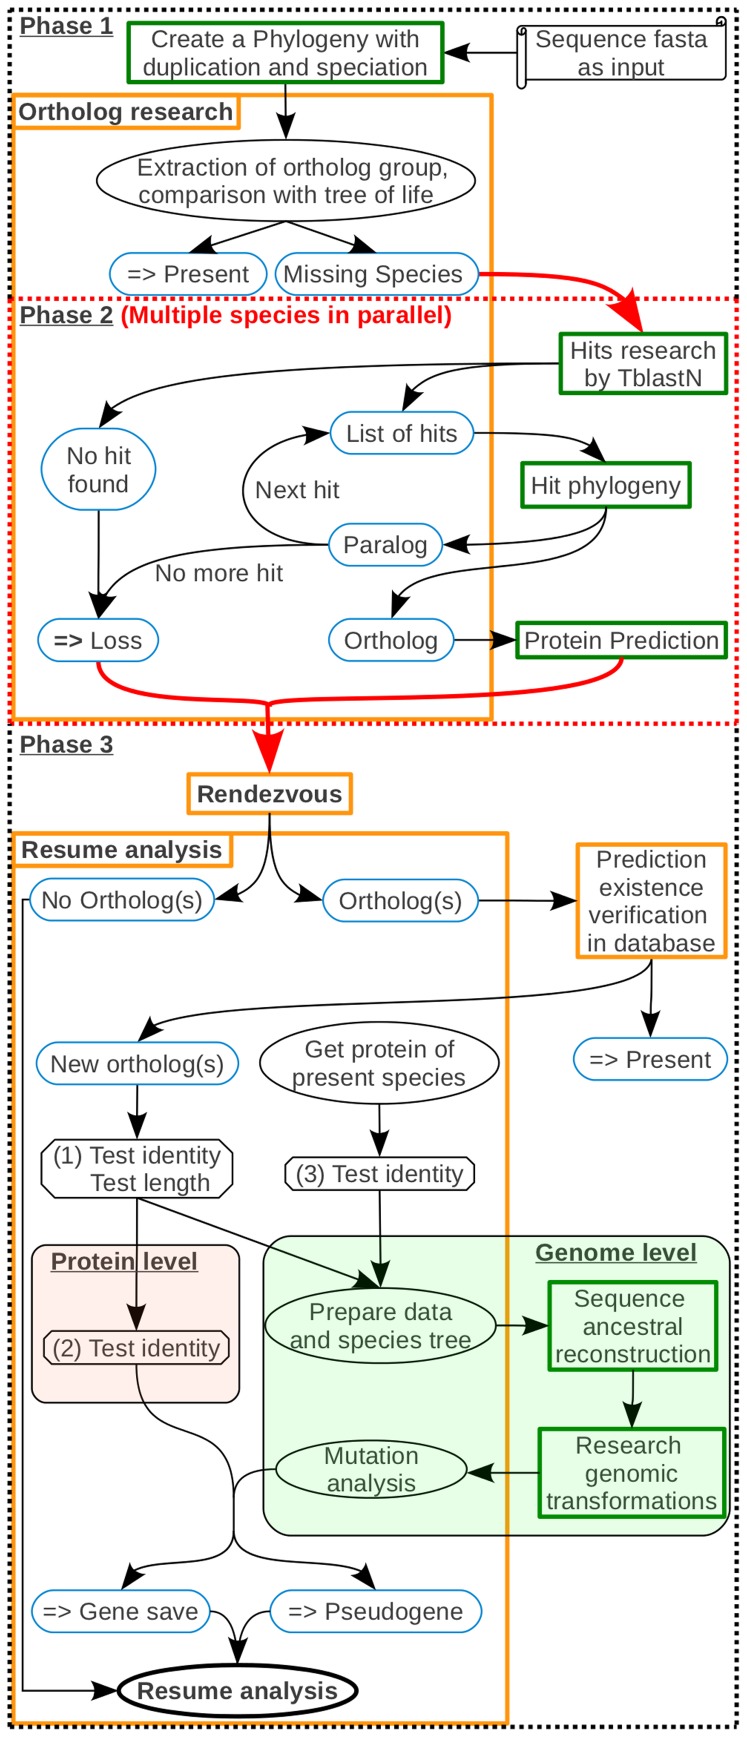
Figure 2. Method for identifying lineage-specific gene losses and pseudogenes.
Parchment illustrates the necessary data for starting a study. Rectangles correspond to agents with their descriptions. The agents launching pipelines are in the green frame. Blue round-edge rectangles highlight essential results. Those with horizontal double arrows are final conclusions. Ellipses are a state or an action. Octagons consist in tests or analyses necessary to define the follow-up on the study. Arrows show the study pathway. Phase 1: Detection of species in which orthologs are missing. Phase 2: Parallel studies screening each orthologous sequence for each missing species. Phase 3: The red arrow is a factorization of the different species studied. The rendezvous agent aims at waiting that all species targeted in the study have been done, before continuing. During this phase, GLADX tries to find the reasons explaining why the orthologs were missing. Depending on the sequences conservation, saved orthologs are analyzed either at protein level, or at nucleotide level, or the both.

