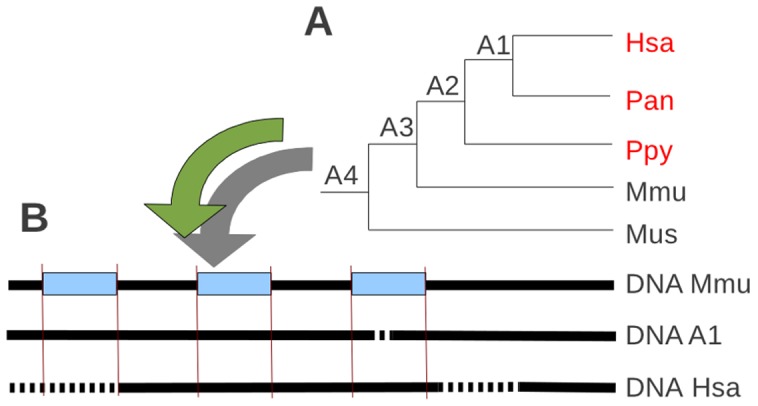
Figure 5. Example of processing sequences from a multiple sequences alignment and their ancestral sequences reconstructed.

(A) Tree of species used for the reconstruction step. Species in red have sequence orthologs retrieved by GLADX. A1, A2, etc. correspond to ancestors reconstructed by Ortheus from orthologous sequences. Once this ancestral reconstruction is finished, the scan step is launched. (B) Sequences considered for an analysis at nucleotide level. Five scans will be carried out (Hsa vs A1, Pan vs A1, Ppy vs A2, A1 vs A2, and A2 vs A3). Only Hsa against A1 is described here. The exon projection is necessary to each scan. Bold black lines are DNA, bold dotted lines are gaps, and red lines are projections from reference exons. Note that all abbreviations concerning species name and their ancestors are provided in Figure 6.
