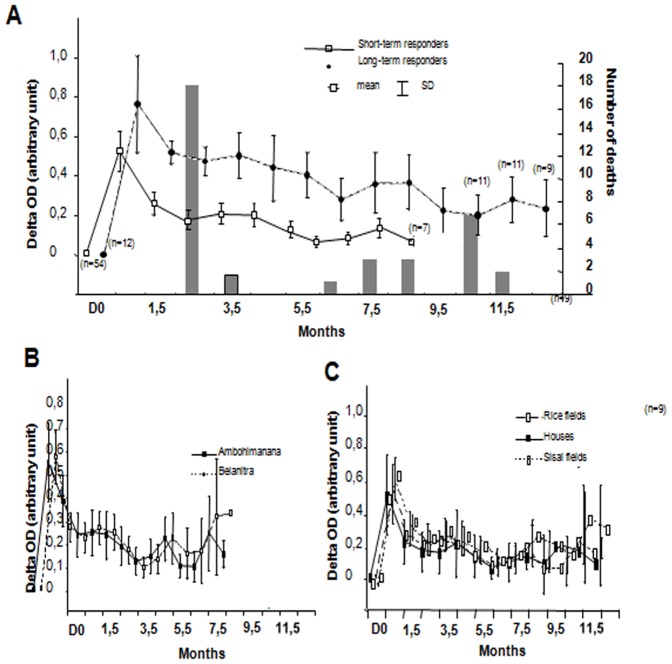
Figure 3. Long term kinetic of anti-F1 IgG in R. rattus after inoculation with 125 cfu of Y. pestis.
Rats captured in three villages were inoculated with 125 cfu of living Y. pestis and blood sampled over 12.5 months using seropads. Anti-F1 IgG measured by ELISA delta OD are plotted. A/Mean of delta OD of survival rats were plotted according to time. Columns represent the number of deaths registered at each time point. Data are separated in two groups, i.e. rats with long-lasting IgG response and those with short-lasting response. Almost no death was registered in the long-lasting group. (n: number of remaining rat in the group at time point) B/Same plot but with data separated according to the villages. No difference between villages was found C/Same plot according to the capture site of the rats showing no difference.

