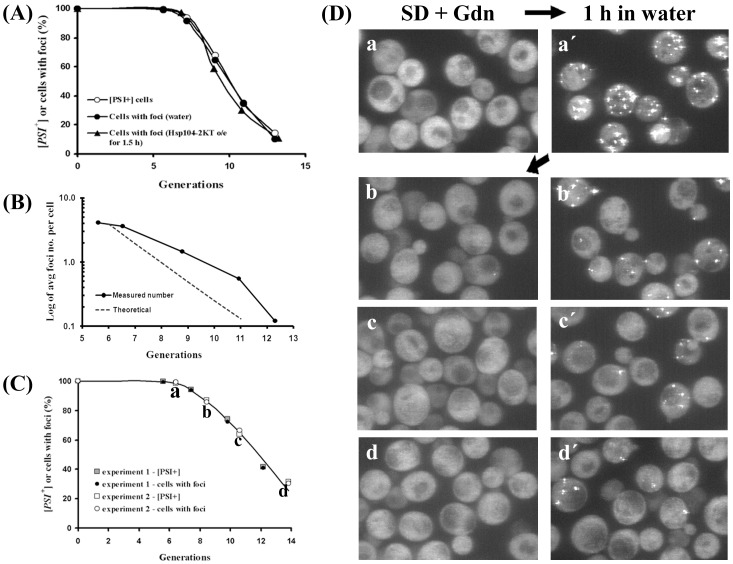
Figure 3. Curing of [PSI+] by guanidine.
(A) Correlation between cells with foci and [PSI +] yeast as a function of generation time during curing by guanidine. The kinetics of [PSI +] curing was measured by plating yeast at indicated generations on ½YPD plates. Yeast having plasmid pFL39-GAL-HSP104KT were grown in SD with 5 mM guanidine. To visualize the foci during curing, cells were incubated at indicated generations either in SGal for 1.5 h to express of Hsp104-2KT or in water for 1 h. The number of cells with foci was counted from Z-stacks of confocal images of fixed cells. Three different experiments yielded similar results. (B) Semi-log plot of average number of foci per cell during curing of [PSI+] by guanidine. For each generation time point, the number of foci was counted in 300–400 fixed cells from Z-stacks of confocal images of fixed cells. Using the initial data point of 4.1 average foci number at 5.6 generations, the theoretical dashed line was calculated by halving the average foci number at each cell division. (C) Curing and fluorescent images of NGMC in yeast during final stages of curing by guanidine. [PSI+] yeast grown for ca. 5 generations in SD with 5 mM guanidine were incubated in water for 1 h to visualize foci, and then the yeast were returned to SD with 5 mM guanidine and incubated further for 7–8 generations. At indicated generations, cells were incubated in water for 1 h and imaged by Z-stack confocal microscopy. Two different experiments are shown. (D) Imaging of the NGMC foci during the late stages of curing of [PSI+] by guanidine. The maximum Z-stack projections of the yeast cells are shown before (a-d) and after incubation in water for 1 h (a′-d′). Cells were imaged in experiment #2 in (C), where a-d shows the indicated generation.

