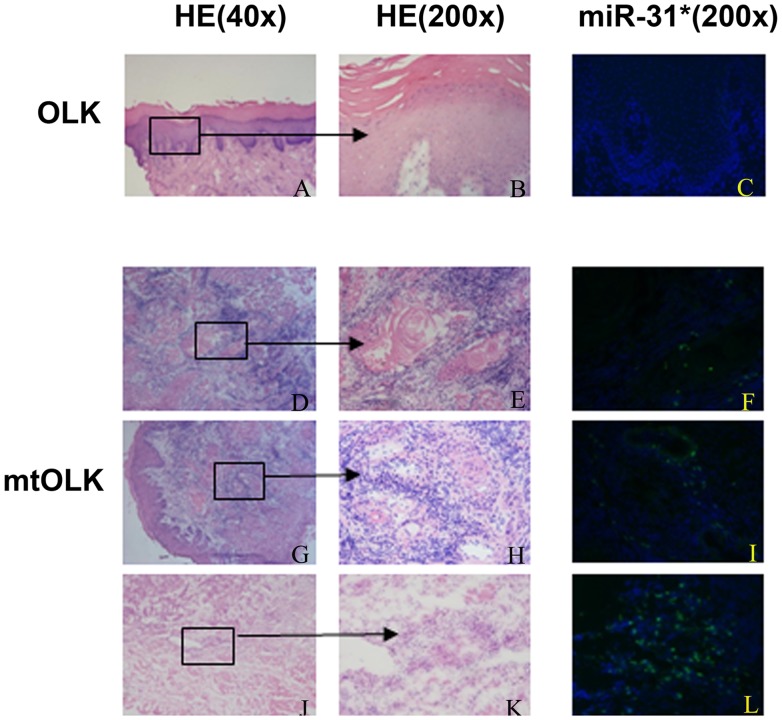
Figure 2. FISH detection of miR-31* expression in OLK and mtOLK.
(A) ∼ (C), no positive signal is detected in OLK. (D) ∼ (L), the representative positive signals are showed in mtOLK. (D) ∼ (F), tumor nest; (G) ∼ (I), vascular area; (J) ∼ (L), inflammation. FISH signals are visualized in green, while blue depicts nuclear DAPI stain. OLK, oral leukoplakia; mtOLK, malignant transformed oral leukoplakia.

