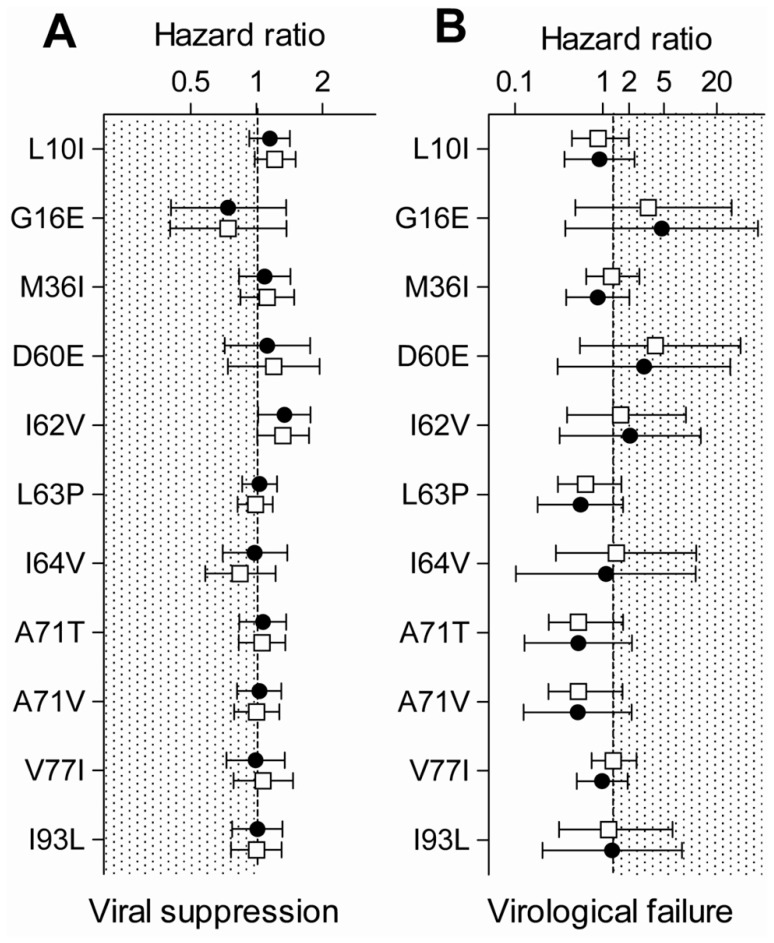
Figure 3. Cox regression models.
Univariable (solid circles) and multivariable (open squares) Cox regression models comparing (A) time to viral suppression and (B) time to virological failure. 95% confidence intervals are indicated. The treatment outcome is worse in the presence of minor protease inhibitor mutations if the hazard ratios lie in the shaded area.

