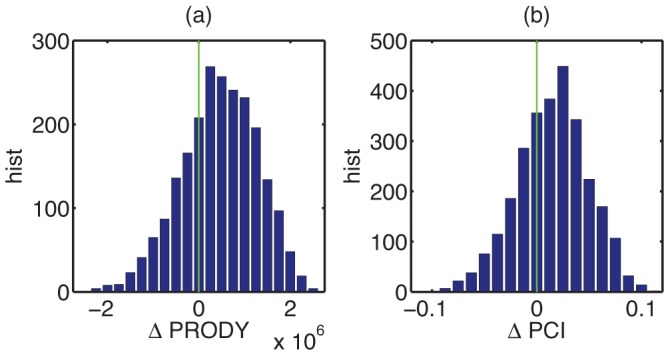
Figure 4. Histograms for change in (a) income level  and (b) product complexity
  associated with individual creative destruction processes.

There is a skew to the positive side in both of them, indicating that national economies are typically restructured into the direction of more complex and higher income products.
