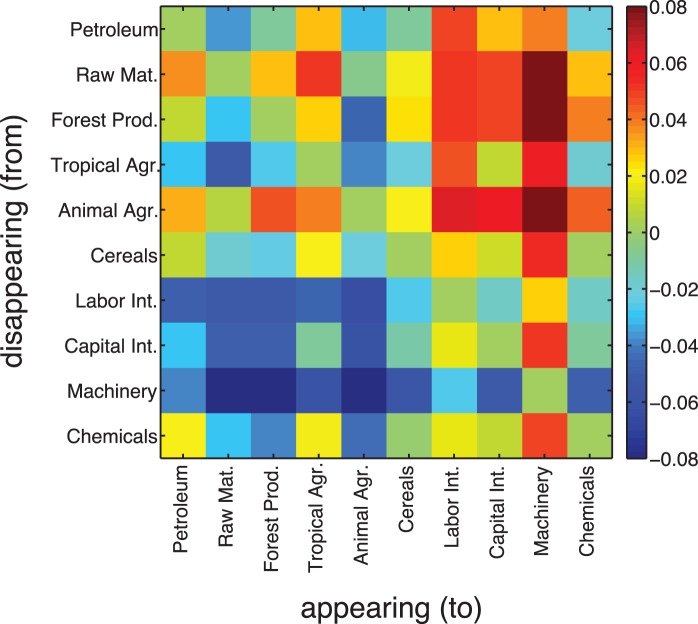
Figure 5. Transition matrix  between Leamer classes.
For each pair of classes  it is measured how often an appearance event of a product from class
  is observed followed by a disappearance of a product from class
  , compared to the opposite direction. Rows are indexed by the appearing Leamer classes
  , columns by disappearing ones
  . A positive value indicates an excess in creative destruction processes between the two classes (from row index to column index). The matrix is by construction anti-symmetric. There is a clear tendency of appearing labor and capital intensive products, as well as machinery and chemicals. Cereals or agricultural products tend to disappear.

