
Figure 3. Analysis of EMT induction with total FN.
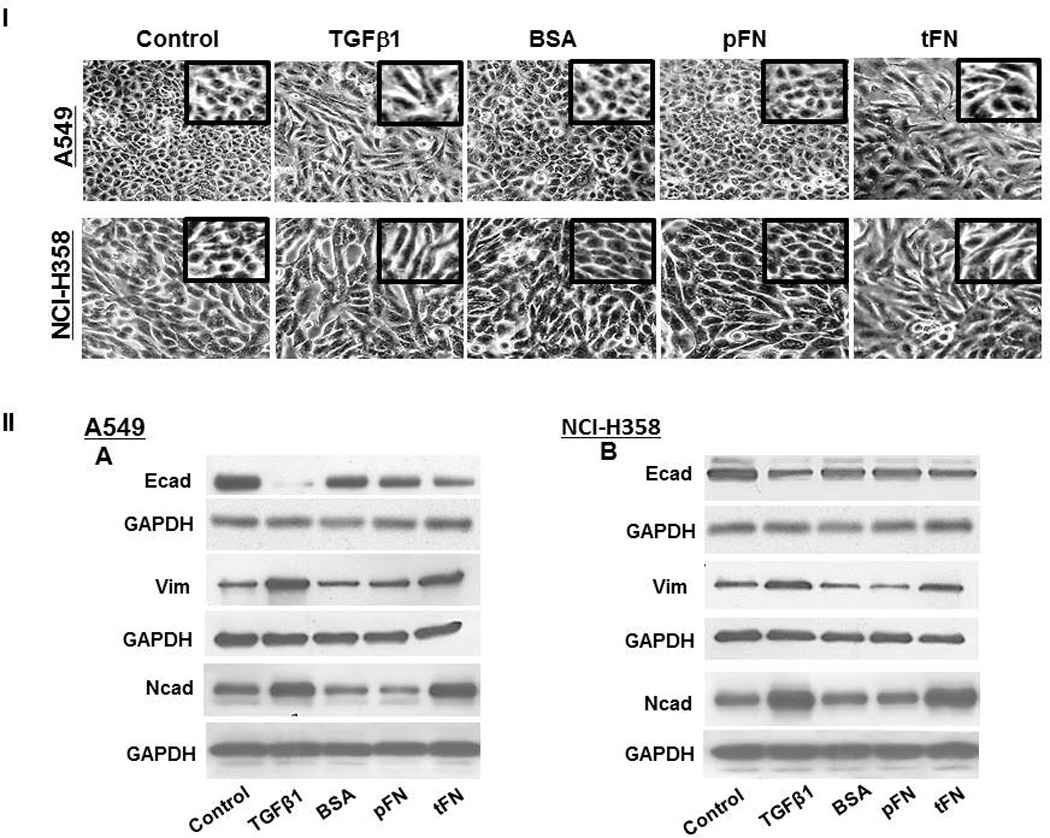
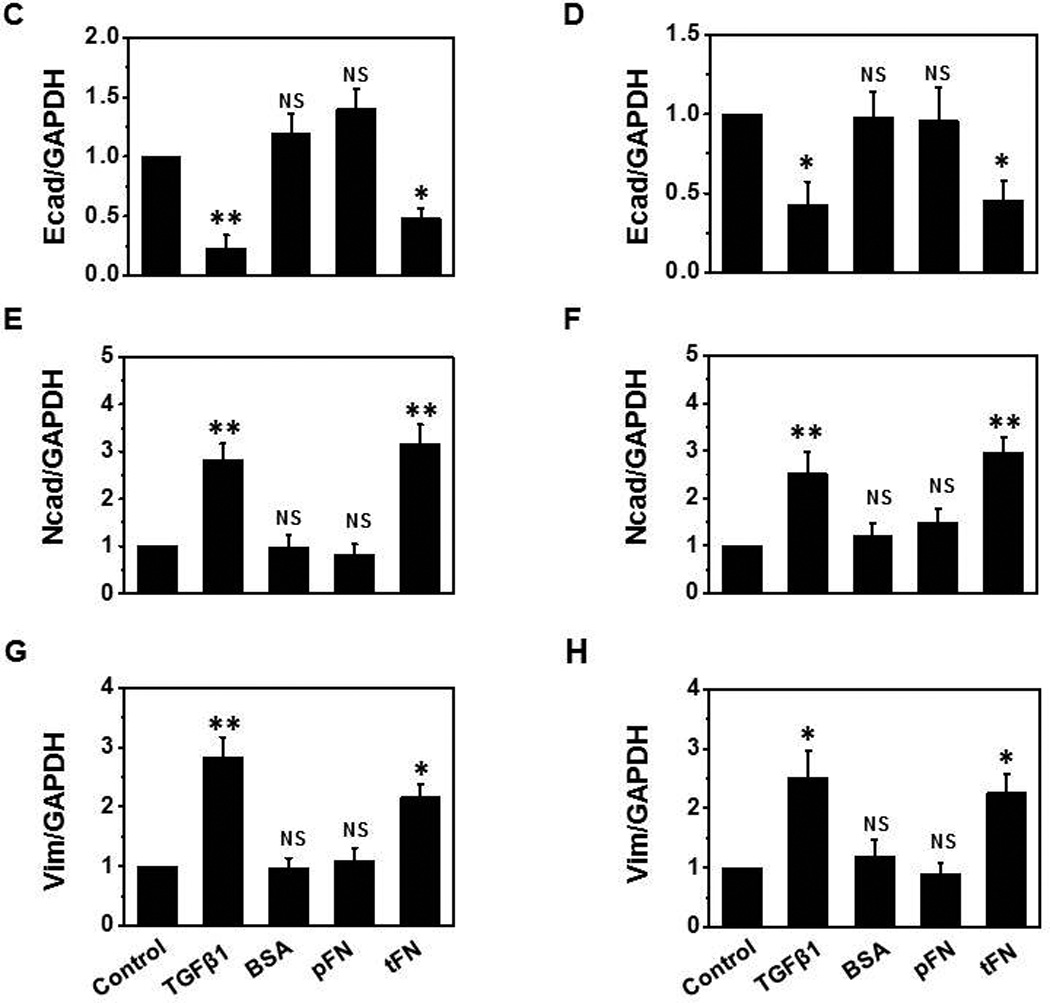
Plates were coated with BSA, plasma FN (pFN), or total FN (tFN), and the cells were seeded on the coated plates as described in M&M. TGFβ1 treatment was used as a positive control. (I) For morphology changes, photos were taken by phase-contrast microscopy (Nikon) at 80X magnification. (II) Expression level of epithelial vs. mesenchymal cell markers were analyzed by Western blot using cell lysates (10 µg protein) of A549 (A, C, E and G) and NCI-H358 cells (B, D, F and H). Representative results from triplicate experiments are shown (A and B). Signal intensities were normalized, and relative intensities are shown as mean ± SD for Ecad (C and D), Ncad (E and F) and vimentin (G and H). ns: not significant; *P ≤ 0.05; **P ≤0.005.