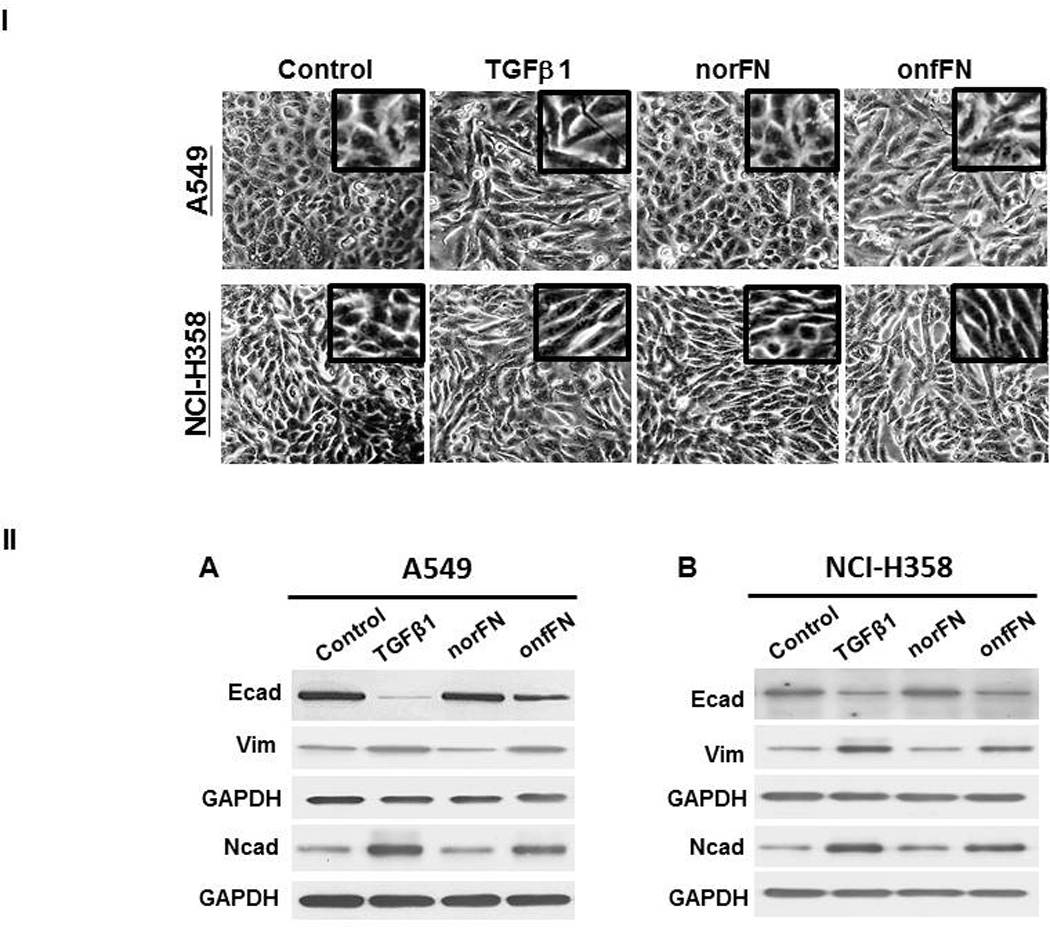
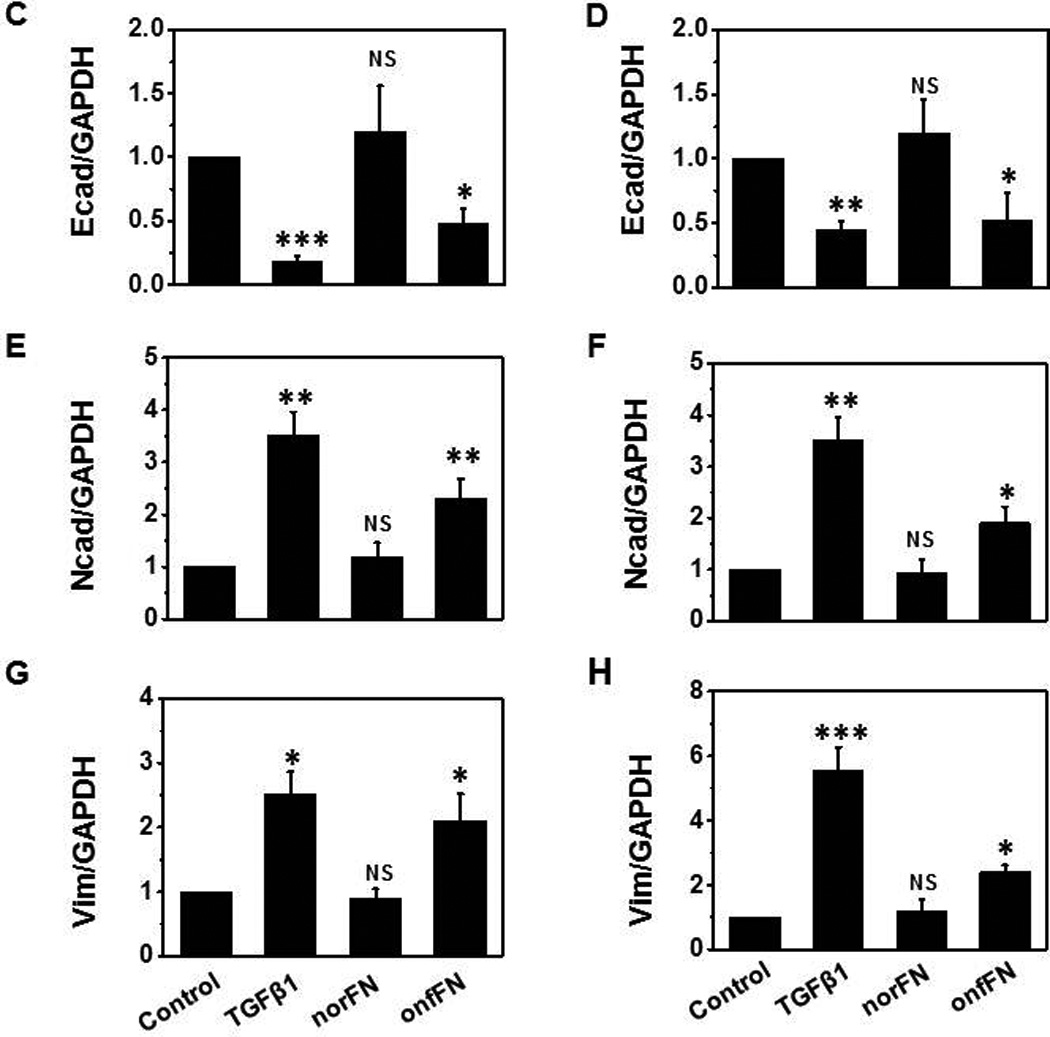
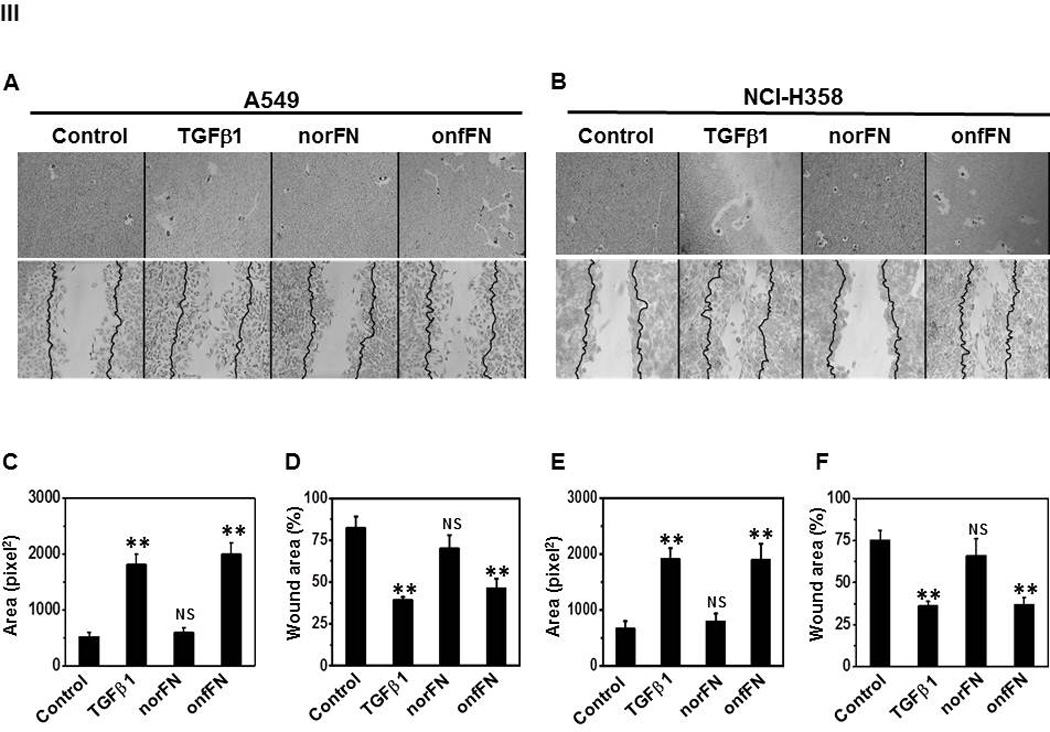
Figure 4. Analysis of EMT induction with onfFN.


Plates were coated with norFN or onfFN and A549 and NCI-H358 cells were seeded as described in M&M. TGFβ1 treatment was used as a positive control. (I) Cell morphology changes were analyzed as described in Fig. 3. (II) Expression level of epithelial vs. mesenchymal cell markers were analyzed as described in Fig. 3. Representative results from triplicate experiments are shown (A and B). Signal intensities were normalized, and relative intensities are shown as mean ± SD for Ecad (C and D), Ncad (E and F) and vimentin (G and H). ns: not significant; *P ≤ 0.05; **P ≤0.005; ***P ≤ 0.001. (III) Cell motility changes induced with the treatments were assessed by phagokinetic assay (Top of A and B) and wound assay (Bottom of A and B). Phagokinetic assay was performed as described in M&M. Photos of track areas of 30 cells were taken; Representative photos are presented. Cleared areas on gold sol were measured, analyzed using the Scion Image program as squared pixels, and are shown as mean ± SD (C and E). n.s.: not significant; *P ≤ 0.05; **P ≤0.005. The wound assay was performed as described in M&M. Pictures of the wounds at the marked position were taken at 0 hr and after an 18 hr incubation. Bold lines show the original edge of the wounds at 0 hr. Results are expressed as mean ± SD of percent of the initial wound area remaining open, analyzed using the Scion Image program (D and F). ns: not significant; *P ≤ 0.05; **P ≤0.005.
