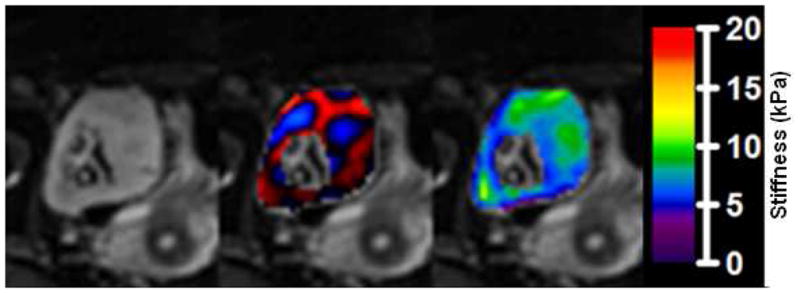
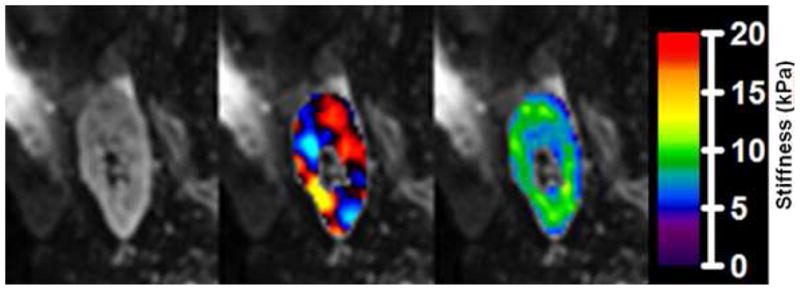
Figure 2. MRE acquisitions in the axial (a) and sagittal (b) planes.


MRE results showing magnitude images from the MRE acquisition (left), fusion of the magnitude image with color-coded propagating shear waves in the kidney (middle), and fusion with color-coded calculated elastogram (right, in kPa).
