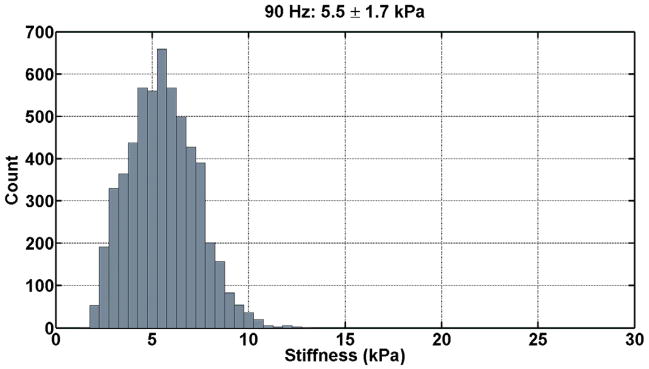
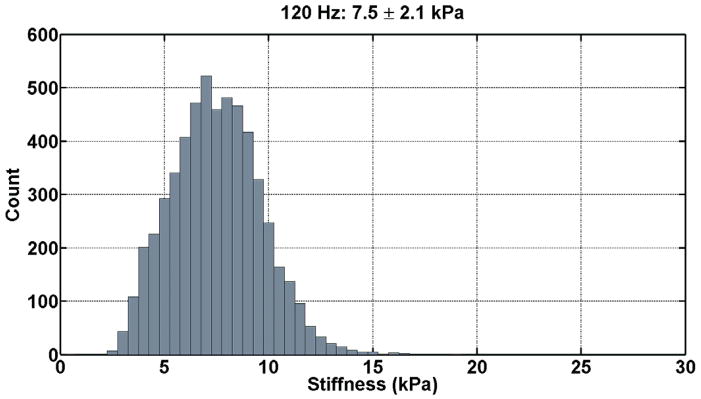
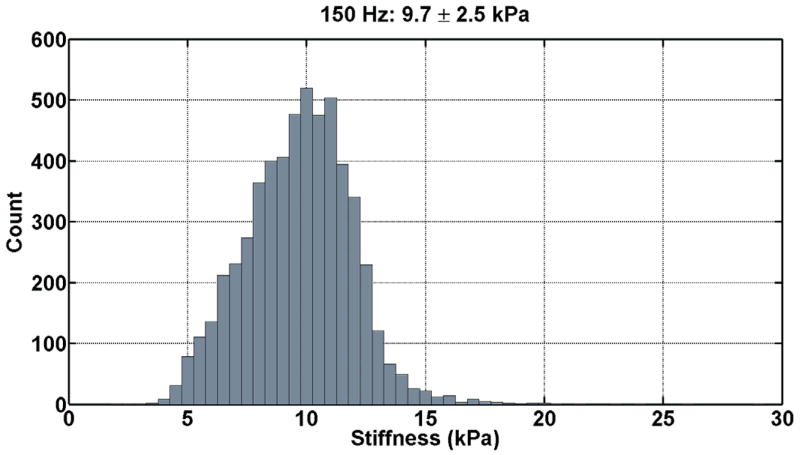
Figure 3. Histograms of the tissue stiffness (kPa) at 90 Hz (a), 120 Hz (b), and 150 Hz (c) for one patient.
These tissue stiffness values were obtained from the segmented volume of non-hilar renal parenchyma. At 90 Hz, the mean tissue stiffness was 5.5 ± 1.7 kPa; at 120 Hz, the mean tissue stiffness was 7.5 ± 2.1 kPa; and, at 150 Hz, the mean tissue stiffness was 9.7 ± 2.5 kPa.


