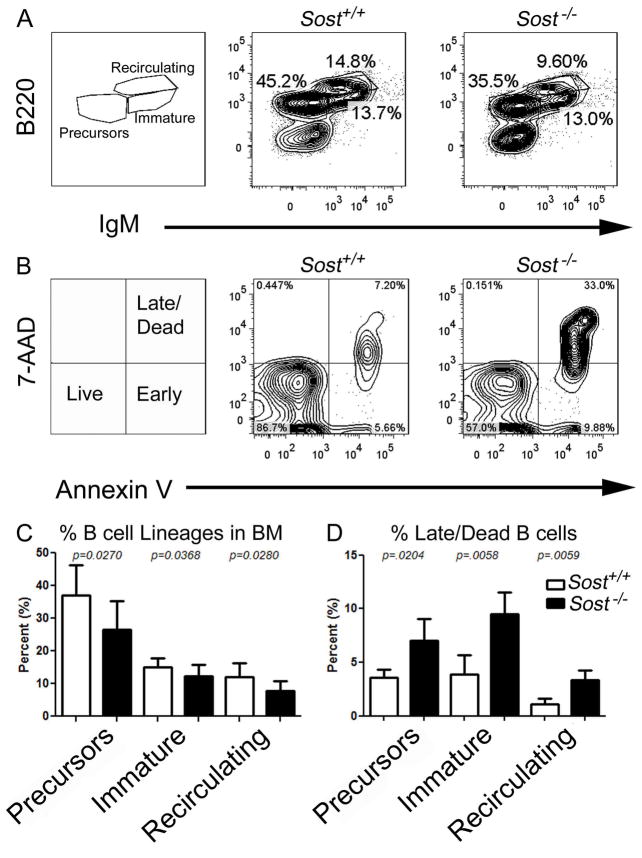
Figure 2. Elevated B cell apoptosis in Sost−/− mice.
(A) FCM plots showing B cell developmental stages from bone marrow. The left panel shows the gating strategy for B cell “precursors” (which includes pre/pro-, pro- and pre-B cells combined), immature and recirculating B cell populations. The middle and the right panels represent staining from the Sost+/+ and Sost−/− mice, respectively. (B) Representative analysis of apoptosis by FCM in “precursor” B cells, as measured by staining with Annexin-V and 7-AAD. Live (Annexin-Vneg, 7-AADneg), early apoptotic (Annexin-Vpos, 7-AADneg) and combined late apoptotic and dead (Annexin-Vpos, 7-AADpos) B cells are discriminated. (C) Total percentages of “precursors” (B220pos, IgMneg) (left panel), immature (B220pos, IgMpos) (middle panel) and recirculating (B220hi, IgMpos) (right panel) B cells in Sost+/+ (n=8) and Sost−/− (n=10) mice. (D) Total percentages of Annexin-Vpos, 7-AADpos ”pre-cursor” (left panel), immature (middle panel) and recirculating (right panel) B cells in Sost+/+ and Sost−/− bone marrow. Data are representative of Sost+/+ (n=4) and Sost−/− (n=3) that are of pooled sexes and 12 to 15 weeks of age. Mean ± SD are shown, and all data were considered to be statistically significant if p < 0.05, two-tailed Student’s T-test.

