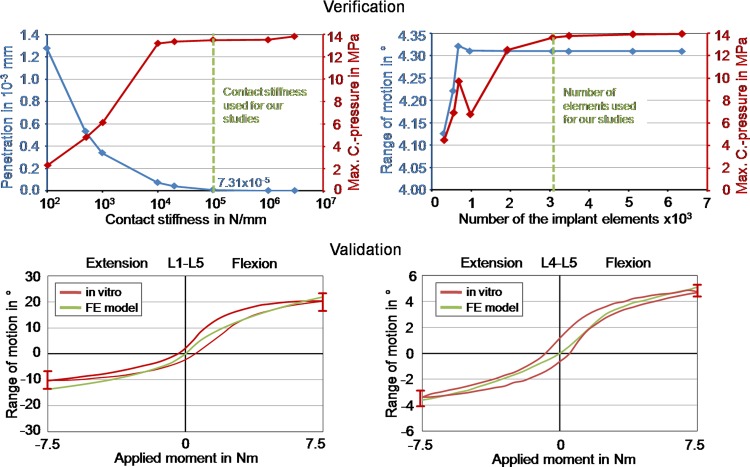
Fig. 2.
Verification and validation of the intact finite element model. Top left peak penetration and contact pressure in relation to the contact stiffness for the contact between inlay and upper metallic endplate. Top right range of motion and contact pressure in relation to the mesh density of the Charité disc. Bottom left calculated total range of motion for L1–L5 under 7.5 Nm in extension and flexion in comparison with in vitro data [24]. The in vitro curve represents the mean value, and the error bars represent the ranges of the in vitro study. Bottom right calculated range of motion for segment L4–L5 under 7.5 Nm in extension and flexion in comparison with in vitro data [24]

