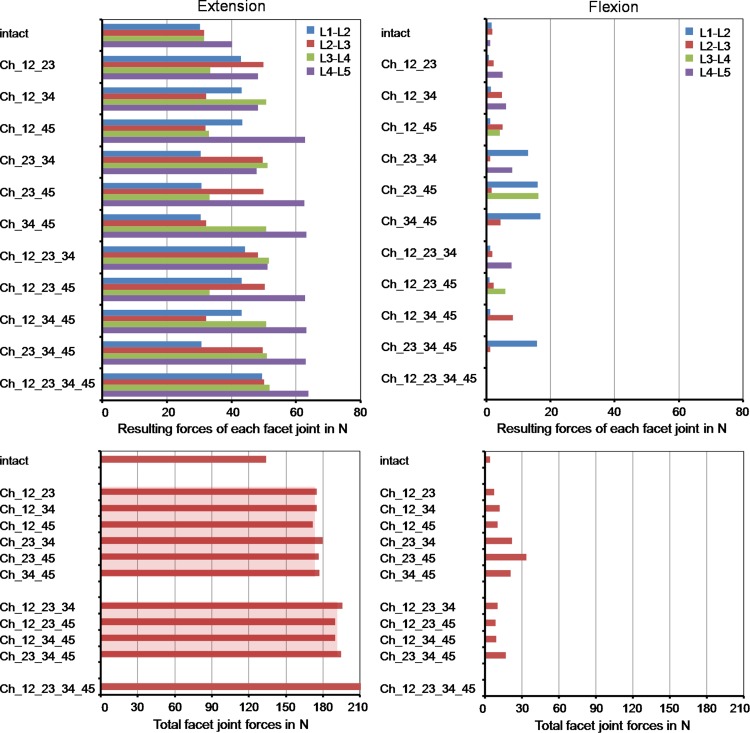
Fig. 4.
Resulting forces for each facet joint (top) and the total facet joint force acting in the whole model (bottom) for different implant scenarios after the application of a follower load and a flexion or extension moment. The broad light red bars represent the mean values of the total facet joint forces for the models including two or three artificial discs

