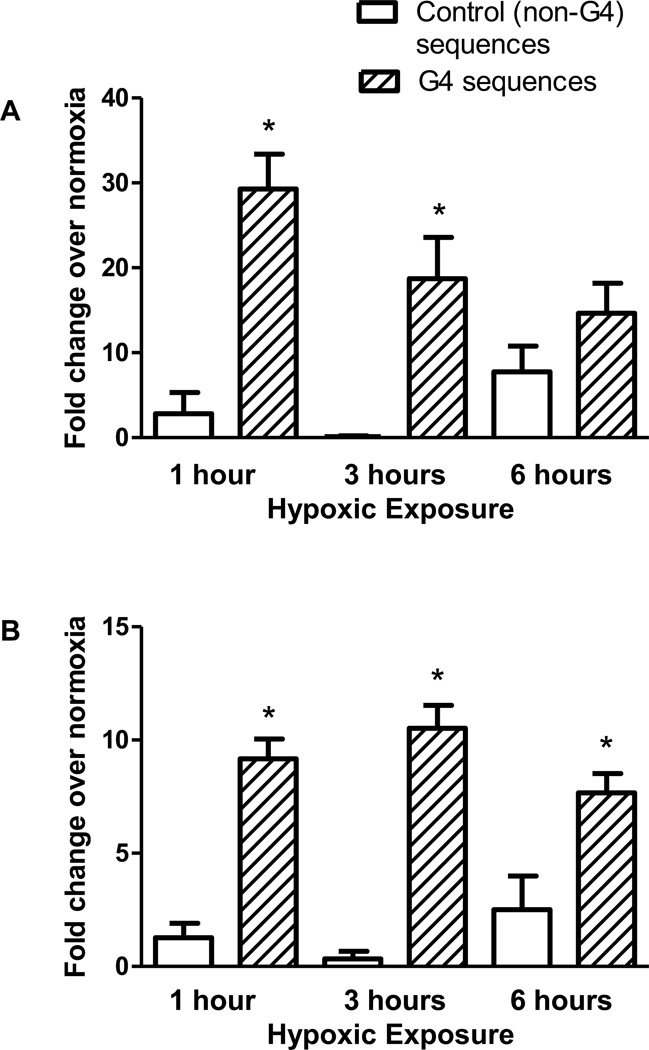
Figure 5.
Comparison of BER enzyme recruitment in G4-containing regions versus control sequences. ChIP was utilized to compare the association of the BER enzymes Ogg1 (A) and Ref-1/APE1 (B) during hypoxic exposure between G4-containing sequences and non-G4 control sequences. N≥8. The error bars indicate S.E.M. * Significantly different between G4 and non-G4 sequences (P<0.05)

